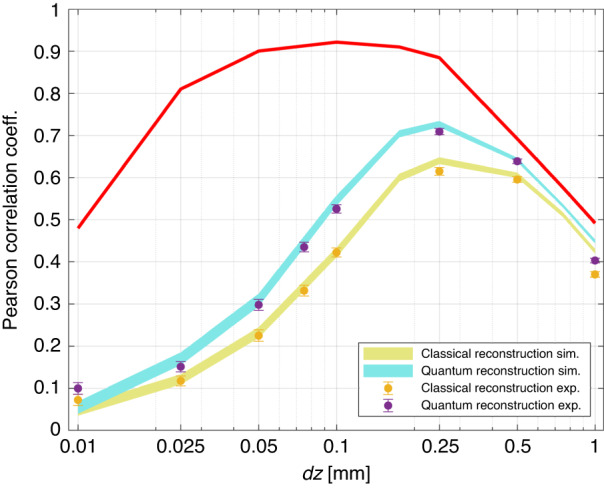
Fig. 4. Pearson correlation between reconstructed and reference images.

The light-blue and yellow curves are the result of a Fourier optics based67 simulation. The line-width is the confidence interval of one standard deviation after an average over 100 reconstructions for each dz. The experimental points are represented as purple and yellow dots with uncertainty bar also corresponding to one standard deviation. The red curve corresponds to the reconstruction obtained by summing of 100 intensity patterns, where the shot noise becomes negligible (in this case, quantum and classical correlation overlaps)
