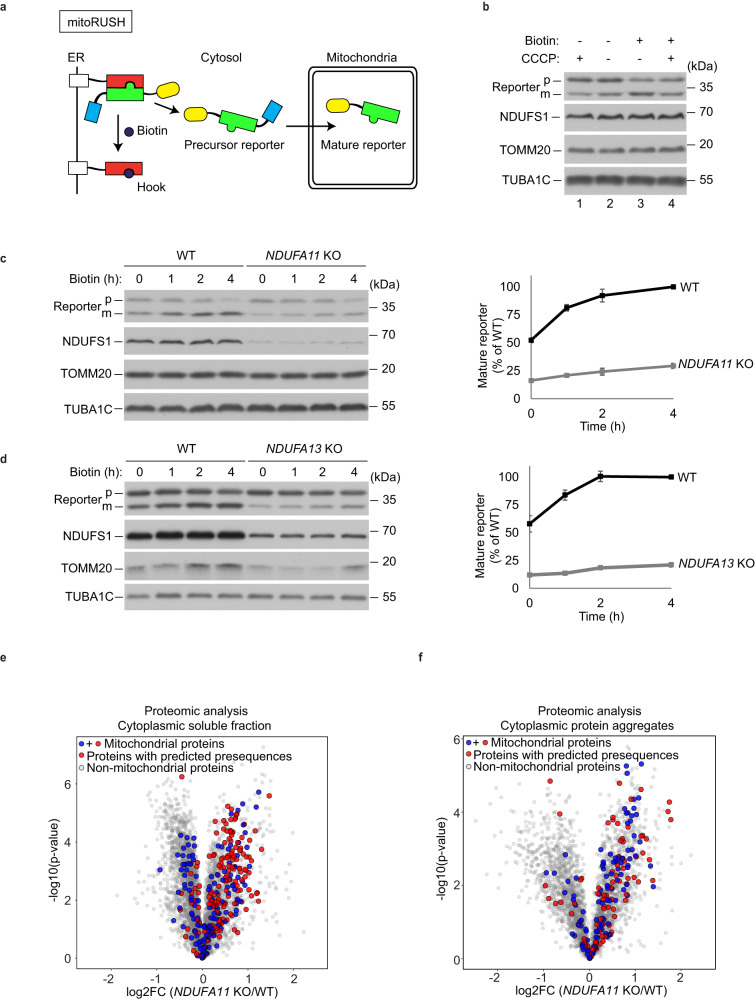
Fig. 2. Mitochondrial complex I deficiency leads to an impairment of mitochondrial protein import.
a Principle of mitoRUSH system used in this study. Red - streptavidin, green - streptavidin-binding peptide, yellow - eYFP, blue - COX8A presequence. b Western blot analysis of the reporter protein expression performed in whole cell lysates of WT HEK293T cells treated with or without 40 uM biotin and/or 10 uM CCCP for 4 h. Western blot analysis of the reporter protein expression performed in whole cell lysates of NDUFA11 KO and WT HEK293T cells (c) or NDUFA13 KO and WT HEK293T cells (d) treated with 40 uM biotin up to for 4 h. NDUFS1 was used to show complex I deficiency. TUBA1C was used as a loading control. Data shown are representative of three independent experiments (left panel). Quantified data shown are mean ± SEM (right panel, n = 3). p, precursor; m, mature. Volcano plot displaying the log2 fold change (log2FC, x axis) against the t-test-derived −log10 statistical p-value (y axis) for all protein groups detected in cytoplasmic soluble fractions (e) and in cytoplasmic protein aggregates fractions (f) of NDUFA11 KO and WT HEK293T cells by LC-MS/MS analysis (n = 3). Student’s t-test (two-sided, unpaired) was performed for the statistical analysis. Mitochondrial proteins with or without predicted presequences, and non-mitochondrial proteins are indicated as red, blue, and gray dots, respectively.

