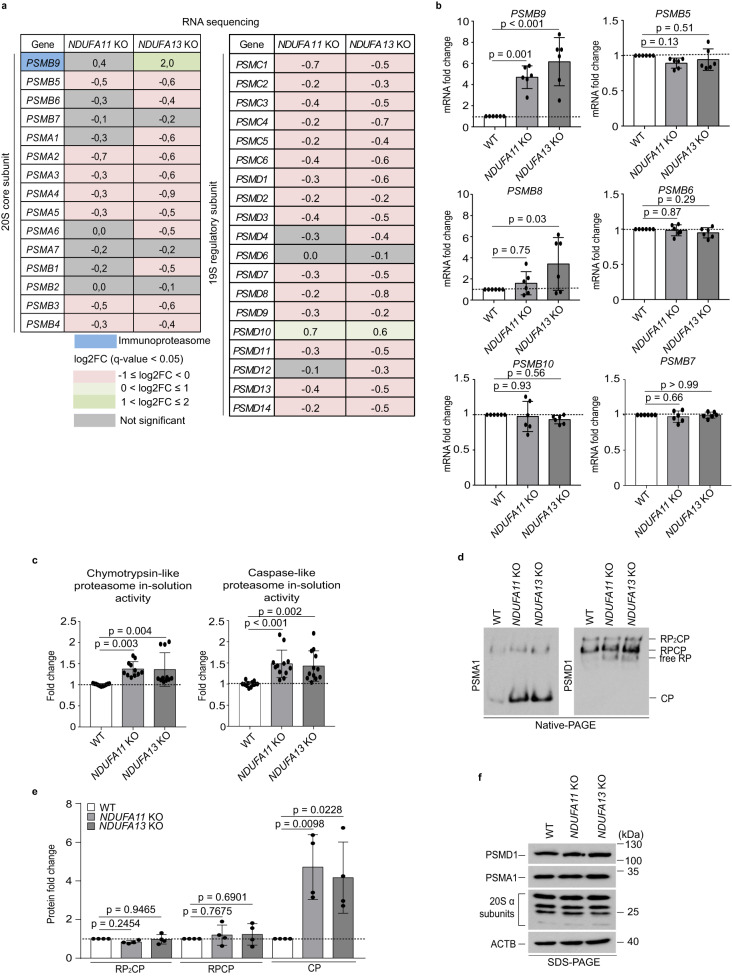
Fig. 3. Mitochondrial complex I deficiency increases PSMB9 mRNA levels and proteasome activity.
a RNA-seq analysis of 20 S (left panel) and 19 S (right panel) proteasome components gene expression log2 fold changes (log2FC) in mitochondrial complex I-deficient HEK293T cells compared to WT HEK293T cells (n = 4). Up- and down-regulated genes (q-value < 0.05) are shown in green and pink, respectively. An immunoproteasome subunit is shown in blue. The intensity of the color shades depends on the level of expression change. Gray indicates genes with not statistically significant expression changes. b mRNA expression patterns of selected transcripts validated by RT-qPCR. The mRNA levels are presented as fold changes relative to WT. Data shown are mean ± SD (n = 3 biological replicates with two technical replicates). p-value from an ordinary one-way ANOVA with Dunnett’s multiple comparisons test using GraphPad Prism. c Chymotrypsin-like and caspase-like proteasome activities in cell lysates presented as fold changes relative to WT. Data shown are mean ± SD (n = 5 biological replicates with one~three technical replicates). **p < 0.01, ***p < 0.001 from an ordinary one-way ANOVA with Dunnett’s multiple comparisons test using GraphPad Prism. d Proteasome species in NDUFA11 KO, NDUFA13 KO and WT HEK293T cell extracts resolved by electrophoresis in 4.5% native gel followed by western blot analysis detecting a 20 S proteasome subunit PSMA1 and a 19 S proteasome subunit PSMD1 to characterize 26 S (RP2CP, doubly capped 26 S; RP1CP, singly capped 26 S) and 20 S (CP, core particle) proteasomes. Data shown are representative of four independent experiments. e Quantification of proteasomes in d using ImageJ. PSMA1 was used to quantify CP, PSMD1 was used to quantify RP1CP and RP2CP. The protein levels are presented as fold changes relative to WT. Data shown are mean ± SD (n = 4). p-value from an ordinary one-way ANOVA with Dunnett’s multiple comparisons test using GraphPad Prism. f Western blot analysis of proteasome subunit expression performed in whole cell lysates of mitochondrial complex I-deficient and WT HEK293T cells. ACTB was used as a loading control. Data shown are representative of three independent experiments. Source data are provided as a Source Data file.

