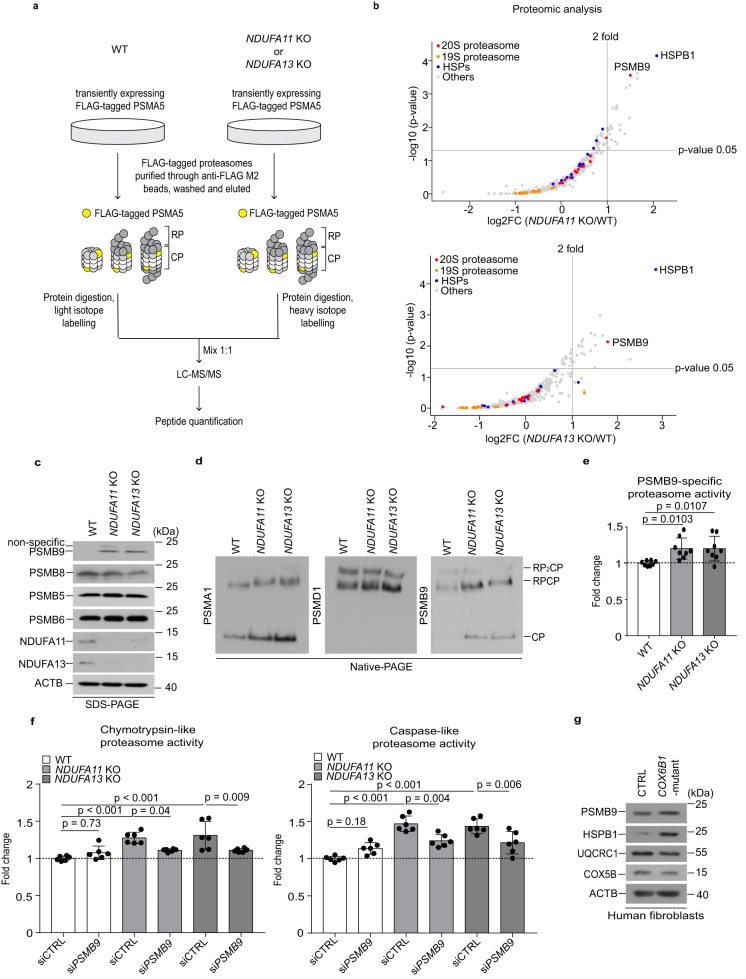
Fig. 4. Mitochondrial stress-induced PSMB9 enhances proteasome activity.
a Workflow of the affinity purification of FLAG-tagged proteasomes by expressing PSMA5-FLAG using anti-FLAG affinity gels for LC-MS/MS analysis. b Volcano plots displaying the log2 fold change (log2FC, x axis) against the −log10 statistical p-value determined following the rank sum method90,91 (y axis) for all proteins quantified in 3/3 replicates of purified proteasomes of NDUFA11 KO versus WT (upper panel) or NDUFA13 KO versus WT (lower panel) HEK293T cells by LC-MS/MS analysis (n = 3). Using this test, p-values were calculated as described by Heskes et al.92. 20 S proteasome subunits, 19 S proteasome subunits, HSPs and others are indicated as red, orange, blue, and gray dots, respectively. c Western blot analysis of the expression of proteasome β subunits performed in whole cell lysates of mitochondrial complex I-deficient and WT HEK293T cells. ACTB was used as a loading control. Data shown are representative of three independent experiments. d Proteasome species in mitochondrial complex I-deficient and WT HEK293T cell extracts resolved by electrophoresis in 4.5% native gel followed by western blot analysis using a 20 S proteasome subunit PSMA1, 20 S immunoproteasome subunit PSMB9 and a 19 S proteasome subunit PSMD1 to characterize 20 S (CP, core particle) and 26 S (RP2CP, doubly capped 26 S; RP1CP, singly capped 26 S) proteasomes. Data shown are representative of three independent experiments. (e) PSMB9-specific proteasome activity in cell lysates presented as fold change relative to WT. Data shown are mean ± SD (n = 4 biological replicates with two technical replicates). p-value from an ordinary one-way ANOVA with Dunnett’s multiple comparisons test using GraphPad Prism. f Chymotrypsin-like and caspase-like proteasome activities in cell lysates presented as fold changes relative to WT 72 h after transfection with PSMB9 (siPSMB9) or control (siCTRL) siRNA. Data shown are mean ± SD (n = 3 biological replicates with two technical replicates). p-value from an ordinary one-way ANOVA with Tukey’s multiple comparisons test using GraphPad Prism. g Western blot analysis performed in whole cell lysates of COX6B1-mutant and control fibroblasts. ACTB was used as a loading control. Data shown are representative of two independent experiments. Source data are provided as a Source Data file.

