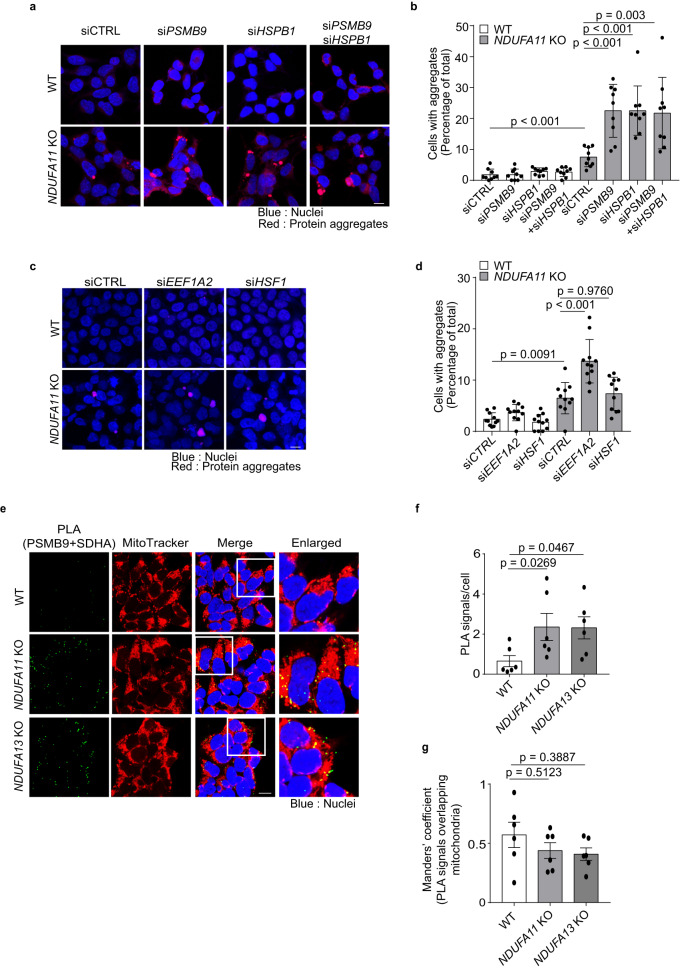
Fig. 6. PSMB9 and HSPB1 are required to maintain proteostasis upon mitochondrial dysfunction.
a, b HEK293T cells were transfected with PSMB9 (siPSMB9), HSPB1 (siHSPB1) or control (siCTRL) siRNA for 72 h. a Images of protein aggregates stained with PROTEOSTAT® dye. Data shown are representative of three independent experiments. The scale bar represents 10 μm. b Quantification of the percentage of cells containing aggregates in a. Counted cell numbers of WT are 1152, 754, 662, 1099; NDUFA11 KO are 787, 534, 677, 794 from left to right. Data shown are mean ± SD (nine sight fields from three independent experiments). p-value from two-sided, unpaired t-test or Mann Whitney test using GraphPad Prism. c, d HEK293T cells were transfected with EEF1A2 (siEEF1A2), HSF1 (siHSF1) or control (siCTRL) siRNA for 72 h. c Images of protein aggregates stained with PROTEOSTAT® dye. Data shown are representative of three independent experiments. The scale bar represents 10 μm. d Quantification of the percentage of cells containing aggregates in c. Counted cell numbers of WT are 3776, 3164, 3659; NDUFA11 KO are 3161, 2462, 3256 from left to right. Data shown are mean ± SD (eleven sight fields from three independent experiments). p-value from an ordinary one-way ANOVA with Tukey’s multiple comparisons test using GraphPad Prism. e Images of PLA performed between SDHA and PSMB9 with co-staining of mitochondria by MitoTracker Deep Red in WT and mitochondrial complex I-deficient cells. Data shown are representative of three independent experiments. The scale bar represents 10 μm. f Quantification of PLA signals per cell in e of WT (n = 102), NDUFA11 KO (n = 110) and NDUFA13 KO (n = 89) HEK293T cells. Data shown are mean ± SD (six sight fields from three independent experiments). p-value from an ordinary one-way ANOVA with Dunnett’s multiple comparisons test using GraphPad Prism. g Quantification of the Manders’ coefficient in e of WT (n = 102), NDUFA11 KO (n = 110) and NDUFA13 KO (n = 89) HEK293T cells. Data shown are mean ± SD (six sight fields from three independent experiments). p-value from two-sided, unpaired t-test or Kruskal-Wallis test with Dunn’s multiple comparisons test using GraphPad Prism. Source data are provided as a Source Data file.

