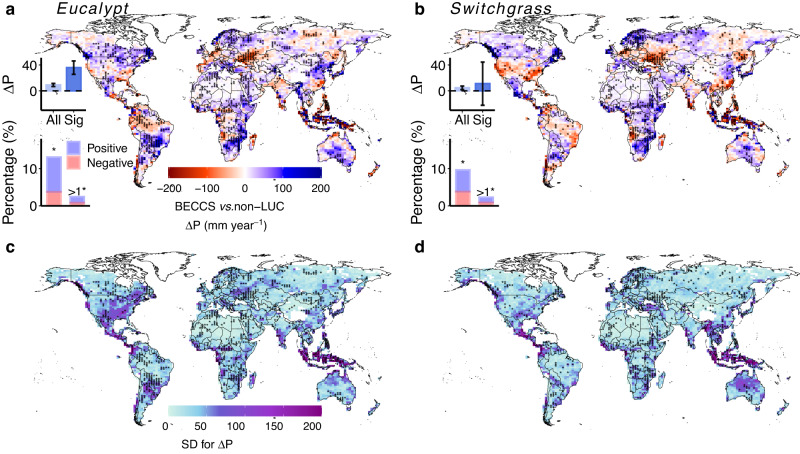
Fig. 1. Spatial patterns of the changes in annual precipitation induced by eucalypt and switchgrass cultivation.
Changes in annual precipitation (ΔP) are calculated as the differences of ten-year (i.e., the last ten years of the 50-year simulation period) annual precipitation between BECCS scenarios and the reference (no land-use change) simulation. a, b Spatial patterns of ΔP for eucalypt (a) and switchgrass (b) cultivation averaged over the three cultivation maps (Fig. S4). c, d Standard deviations (SD) of ΔP over the three cultivation scenarios for eucalypt (c) and switchgrass (d) cultivation. Stippling indicates that changes are statistically significant (according to the Wilcoxon signed-rank test at the 95% confidence level, p < 0.05) in at least one cultivation map. In (a, b), the upper insets show mean and standard deviations of ΔP over the entire global land area (left, labeled as “All”) and over regions with statistically significant precipitation changes (right, labeled as “Sig”). The lower insets show percentages of the global land area with significant changes detected in one (left) or more than one (right) of the three cultivation maps, with positive changes shaded blue and negative changes shaded red.

