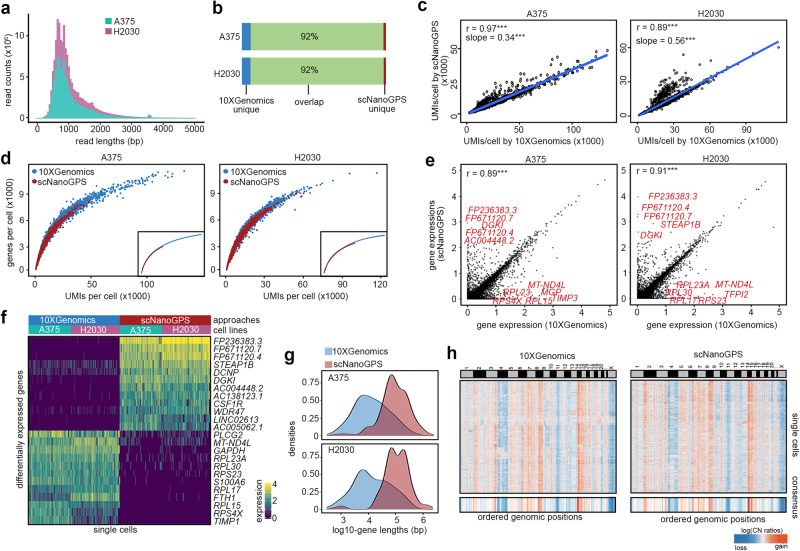
Fig. 2. Performance of scNanoGPS in processing scNanoRNAseq data.
a Length distribution of raw reads of two cancer cell lines. b Intersection of true cell barcodes detected by scNanoGPS and standard NGS approaches. c Pair-wised scatter plots of UMI counts per cell detected by two approaches. ***, Pearson correlation P-value < 2.2e−16. d Pair-wised scatter plots of gene detection versus UMI counts of single cells. e Single-cell gene expression levels calculated by two approaches. ***, Pearson correlation P-value < 2.2e−16. f Heatmap of genes with significantly different expression levels in two approaches. g Density plots of the length of genes with significantly different expression levels in two approaches. h Heatmap of single-cell copy number profiles of H2030 calculated by CopyKAT from matched single-cell transcriptomes of two approaches. Source data are provided as a Source Data file.

