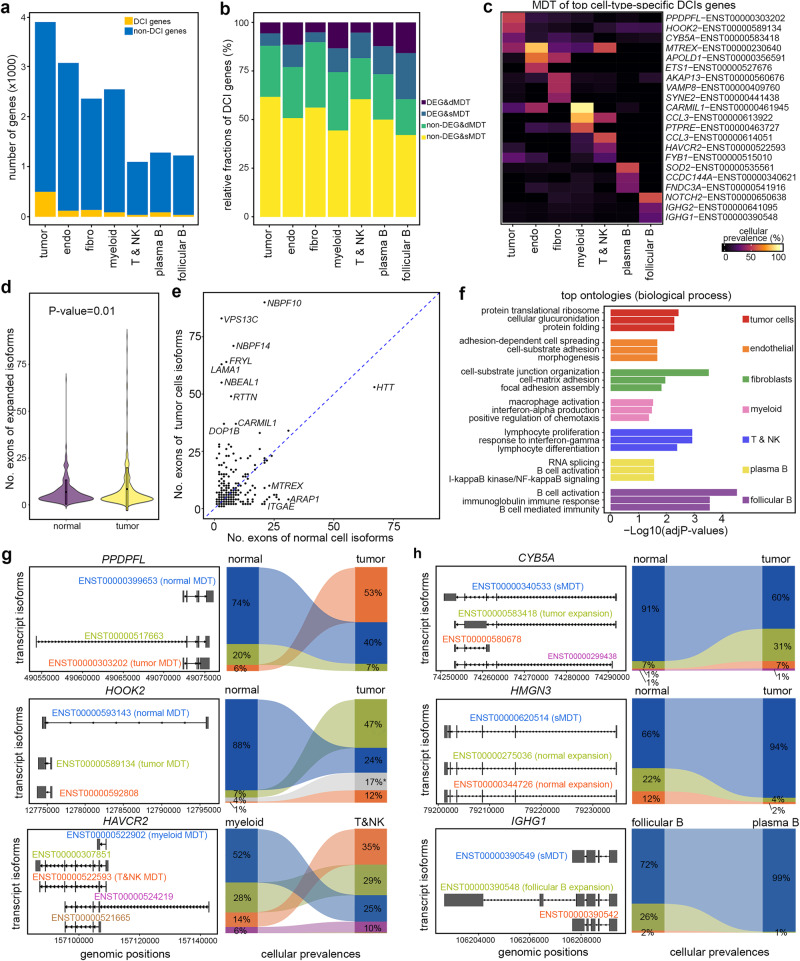
Fig. 4. Profiling cell-type-specific isoforms in the tumor microenvironment.
a Numbers of genes with DCIs in seven cell types of a kidney tumor. b Stratification of genes with DCIs based on the status of gene expression levels and most dominant transcripts (MDTs). dMDT distinct among cell types, sMDT shared across cell types. c Heatmap of the cellular frequencies of top cell-type-specific MDTs. d Violin plot of numbers of exons of tumor and normal cell preferred isoforms. P-value: two-sided paired t-test (n = 335). Boxes inside the violin plots are centered at the median and bounded by the first (Q1) and third quartile (Q3). e Pair-wised scatter plot of the numbers of exons of expressed genes in tumor and normal cells. f Top gene ontologies (MSigDB: GO: BP) of cell-type-specific DCI genes. P-values: Fisher’s Exact t-test, adjusted with Benjamini and Hochberg method. g Examples of cellular frequencies of isoforms of genes expressing different MDTs in different cell types. h Examples of cellular frequencies of isoforms of genes expressing the same MDTs in different cell types. Source data are provided as a Source Data file.

