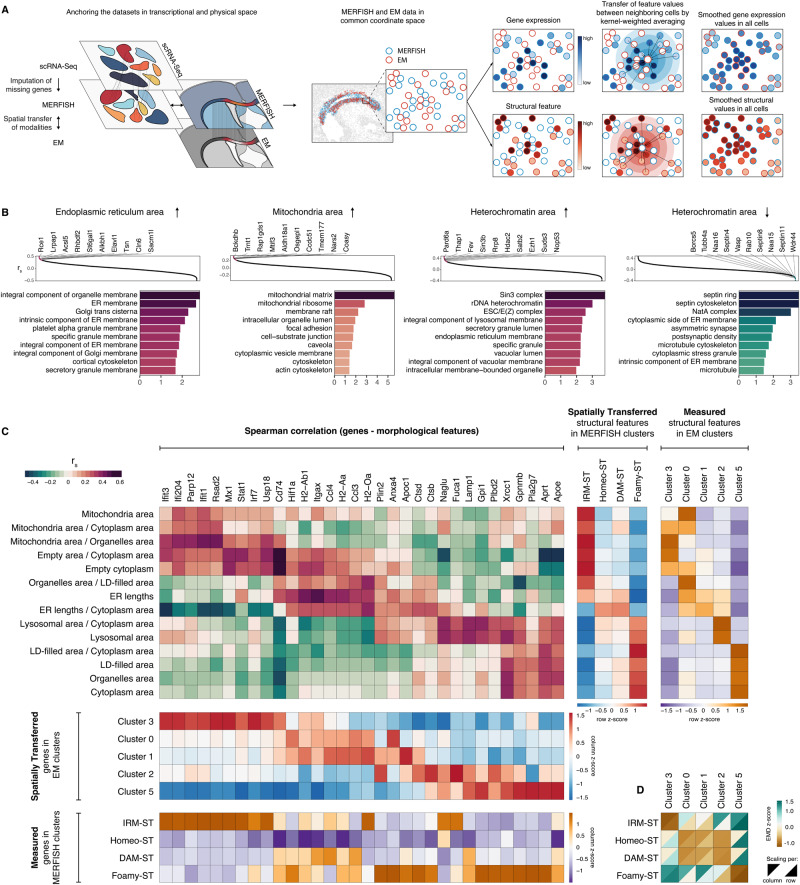
Fig. 6. Correlation of gene expression and structural features in microglia.
A Schematics of the computational strategy for spatial transfer of modalities followed by gene-structure correlation analysis. Unmeasured genes in MERFISH are imputed from SmartSeq2 data. MERFISH and EM data from adjacent sections are registered to common coordinate space. Gene expression values as well as structural feature values are then transferred between neighboring cells using distance-weighted averaging. B Rank plots of Spearman correlation between genes and selected structural features (top). Barplots on the bottom show enriched Gene Ontology Cellular Component terms among the top 200 positively (shades of red) or negatively (shades of green) correlating genes with respective structural feature. One-sided hypergeometric test, nominal p-value. C Heatmaps showing correlation between selected genes and structural features in microglia (red-green palette), average values of spatially transferred modality in ST and EM clusters (red-blue palette), and average values of directly measured modality in ST and EM clusters (orange-purple palette). D Heatmap of multiscale Earth Mover’s distances (EMD) between feature-based structural clusters and ST-derived clusters. Z-scored values per structural cluster (row scaling) as well as per ST cluster (column scaling) are shown. A was created with elements from BioRender.com.

