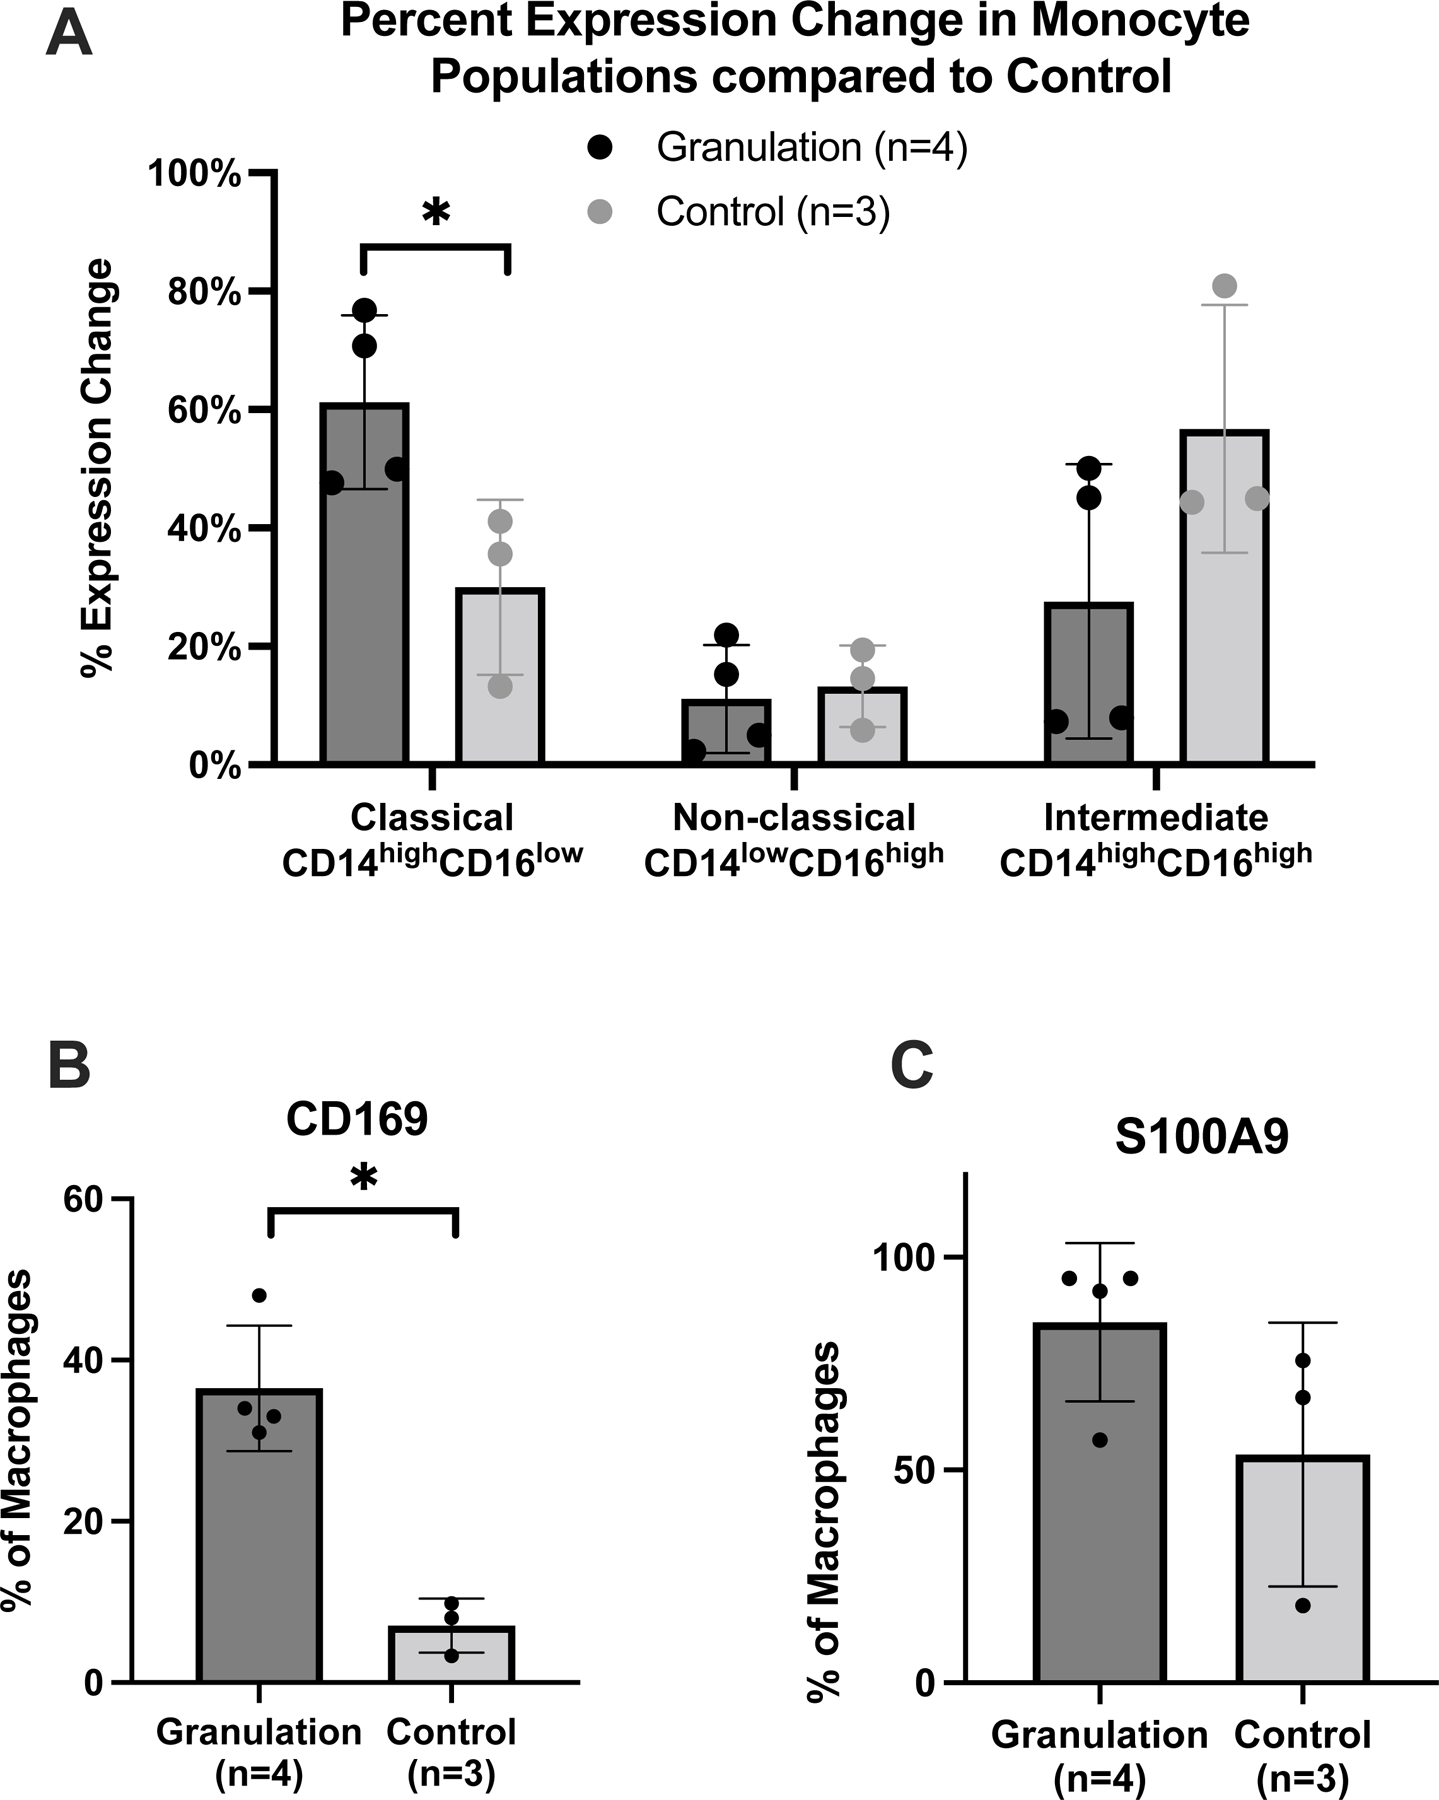
Figure 3: Monocyte and tissue resident macrophage subpopulations in granulation tissue.

(A) Flow cytometry results designating intermediate, classical, and non-classical monocyte populations based on CD16 and CD14 antigen staining. (B) Tissue resident macrophages, defined by percentage of macrophages staining positive for CD169. (C) Percentage of macrophages staining positive for S100A8/A9. Values represent percent of monocytes or macrophages present in tissue population. Error bars signify standard deviation. (*) = p < 0.05.
n=number of samples
