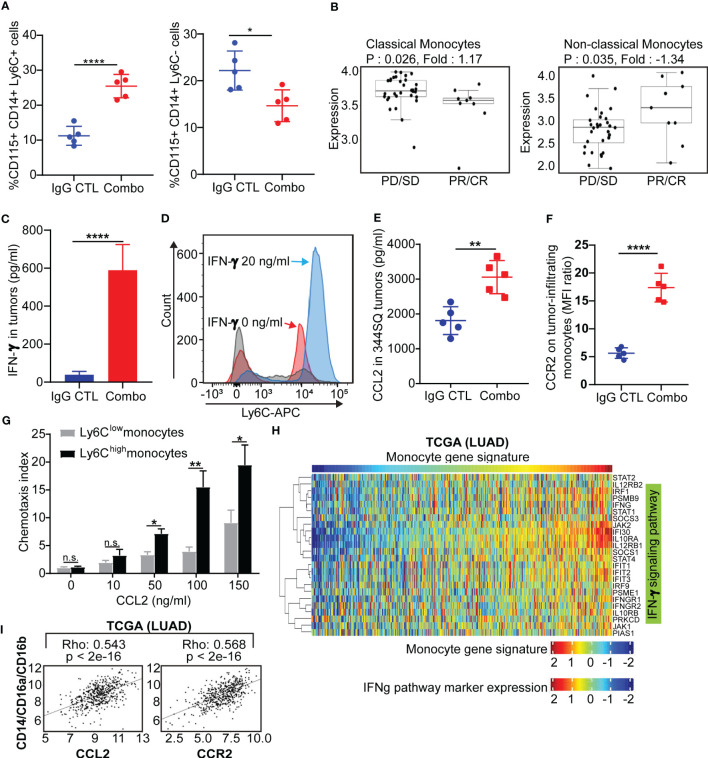
Figure 4.
Classical Ly6C+ monocytes in anti-PD-1/CTLA-4 resistant tumors is mediated by IFN-γ and the CCL2-CCR2 axis (A) 129/Sv mice were treated weekly with combined anti-PD-1 and anti-CTLA-4 (Combination: 200 µg of anti-PD-1 plus 200 µg of anti-CTLA-4 per mouse) or their IgG control mixture (IgG control) beginning on day 7 after a subcutaneous 344SQ cancer cell injection (0.1 x 10⁶ cells per mouse; n = 5) for 7 weeks. FACS analysis from intertumoral monocytes CD115+CD14+ monocytes and Ly6C+ (left) or Ly6C- (right). (B) Classical monocytes and non-classical monocytes from melanoma nivolumab treated patients (GSE91061). (C) 129/Sv mice were treated weekly with combined anti-PD-1 and anti-CTLA-4 (Combination: 200 µg of anti-PD-1 plus 200 µg of anti-CTLA-4 per mouse) or their IgG control mixture (IgG control) beginning on day 7 after a subcutaneous 344SQ cancer cell injection (0.1 x 10⁶ cells per mouse; n = 5) for 7 weeks. The IFN-γ concentrations in tumors were measured by ELISA assay. (D) The monocytes were sorted (CD45+CD11b+CD115+Ly6G- for sorting) from untreated 344SQ tumors. 10,000 monocytes were plated in the 12-well plate. After 12 hrs of IFN-γ (20 ng/ml) stimulation, the expression of Ly6C on monocytes was analyzed by FACS. The experiments were repeated at least three times. The representative histograms are shown. (E) The CCL2 concentrations in tumors treated with IgG CTL or combo treatment were measured by ELISA assay. (F) Monocytes from IgG CTL or combo treated 344SQ tumors were harvested at week 7 and FACS for analyzing CCR2 expression on total monocytes. (G) The sorted Ly6Chigh or Ly6Clow monocytes from 344SQ tumors were added to the upper chamber of the transwell (1 × 10⁴ cells/transwell) in the presence of CCL2 with indicated concentrations. Transwell plates were incubated at 37 °C for 90 minutes. The transmigrated cells were collected from the lower chamber and analyzed by a flow cytometer. The chemotaxis index represents the fold increase in the number of migrated cells in response to CCL2 over the spontaneous cell migration. (H) Heat map of association between the mRNA levels of human monocyte gene signature and IFNγ pathway in the TCGA lung adenocarcinoma (n = 1008). Spearman correlation with adjusted p value < 0.05 was used as the criteria to select the most significant IFN-γ-related markers for generating the heat map. (I) Spearman’s rank correlation (Rho) was used to assess the association between CCL2/CCR2 and human monocyte marker expression in lung cancer patients’ samples from TCGA (LUAD). The results are shown with t-test. n.s., no significant difference; *p < 0.05; **p < 0.01; ****p < 0.0001.

