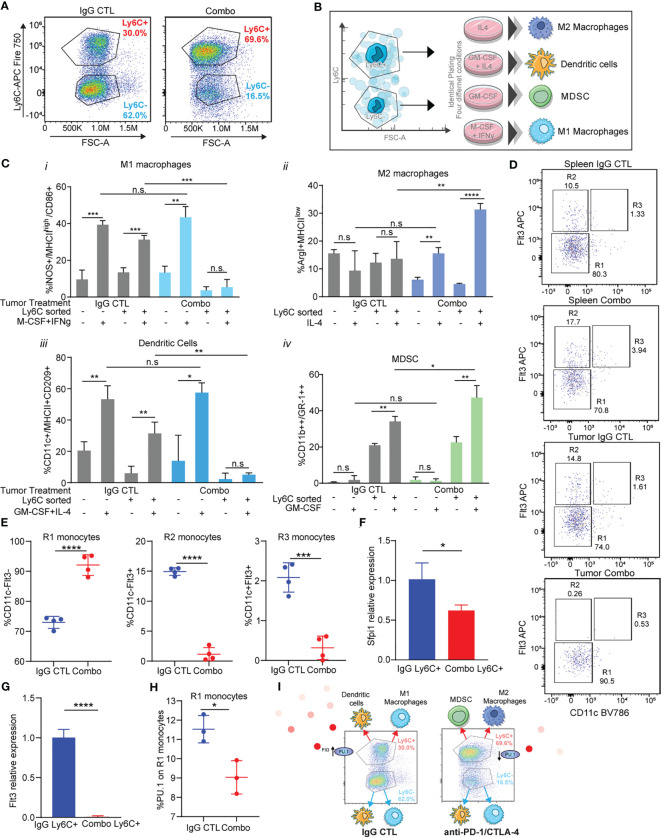
Figure 5.
Immunotherapy resistant Ly6C+ monocytes have decreased antigen presenting cell differentiation capacity due to loss of Flt3/PU.1. (A) Tumor-infiltrating monocytes sorted from 344SQ tumors treated with IgG control or combo (anti-PD-1/CTLA-4) are classified into two populations: Ly6C+monocytes and Ly6C-monocytes. (B) The trans-differentiation assay scheme. (C) The differentiation assays were performed under different conditions. The percent of M1 macrophage, M2 macrophage, MDSC, or dendritic cell in total monocytes were analyzed with their markers by FACS at the end points. (D) heterogeneity of intertumoral Ly6C+ monocytes from 344SQ tumors treated with IgG CTL or combo (anti-PD-1/CTLA-4) for 7 weeks. Flt3 and CD11c flow dot plots were used to characterize Ly6C+ monocytes. R1, R2, and R3 gates are found in box gates. (E) Percentage of R1 monocytes CD11c-Flt3-, R2 monocytes CD11c-Flt3+, and R3 monocytes CD11c+Flt3+ from Ly6C+ intertumoral monocytes treated with IgG CTL or combo until week 7. (F) qPCR of Sfpi1 from Ly6C+ FACS sorted monocytes from IgG CTL or combo (anti-PD-1/CTLA-4) treated tumors. (G) qPCR of Flt3 from Ly6C+ FACS sorted monocytes from IgG CTL or combo (anti-PD-1/CTLA-4) treated tumors. (H) Intracellular percentage of PU.1 levels on R1 monocytes from Ly6C+ FACS sorted monocytes from IgG CTL or combo (anti-PD-1/CTLA-4) treated tumors. (I) schematic showing differentiation results from (C) and loss of Flt3/PU.1 in the combo (anti-PD-1/CTLA-4) resistant Ly6C+ monocytes. ANOVA test is shown. n.s., no significant difference; *p < 0.05; **p < 0.01; ***p < 0.001; ****p < 0.0001.

