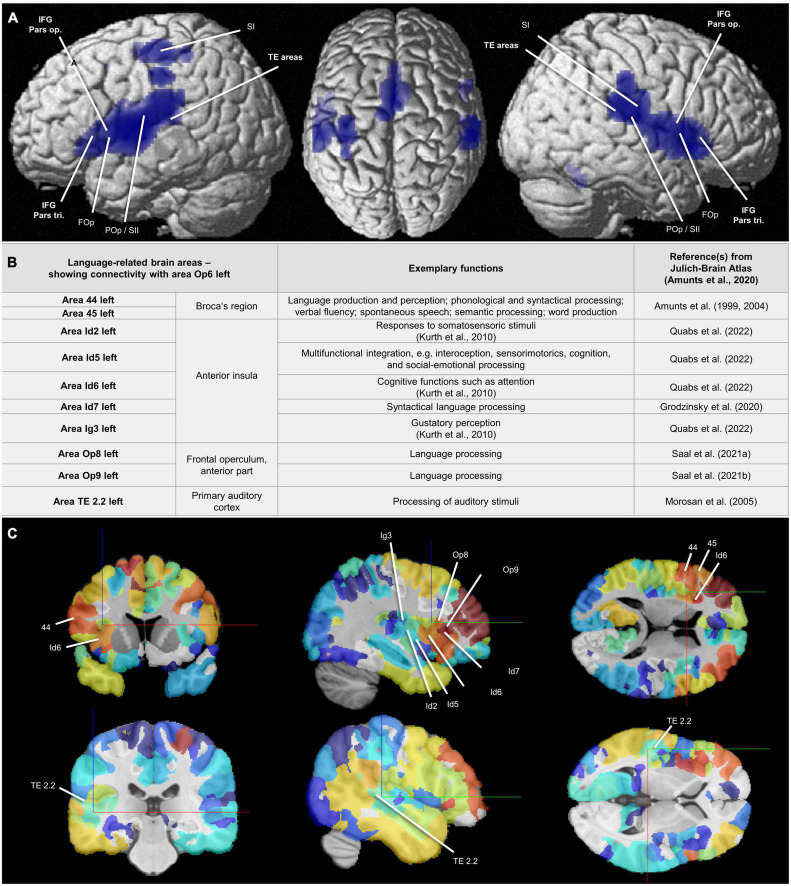
FIGURE 10.
(A) Areas Op5–Op7: Results of the conjunction analysis displayed on the cortical surface (MNI ICBM 152 reference brain) (Nichols et al., 2005) proving combined co-activation of the areas Op5-Op7 calculated by meta-analytic connectivity modeling (MACM) (Eickhoff et al., 2011). The analysis revealed that areas Op5-Op7 showed co-activational connectivity with area 44 (Broca’s region), with the FOp, and with the TE areas. Also with the POp and and with parts of the somatosensory cortex, all FOp areas showed co-activational connectivity. FOp = frontal operculum; IFG Pars op. = inferior frontal gyrus, opercular part; IFG Pars tri. = inferior frontal gyrus, triangular part; POp/SII = parietal operculum/secondary somatosensory cortex; SI = primary somatosensory cortex; TE areas = auditory cortex in the temporal lobe. (B) Area Op6 left: Language-related brain areas that showed connectivity with area Op6 left in the present study and thus were connected with the FOp in a network. For full connectivity results, see Supplementary Tables 3, 4. Additional reference: Kurth et al. (2010)—for citation, see Supplementary material. (C) Structural connectivity of area Op6 left: Frontal, sagittal, and coronal sections in the MNI ICBM 152 reference space (two different cutting heights). Marked are areas associated with selected functions including language, which show a structural connectivity to Op6 left. Level of structural connectivity to Op6 left from the 1000BRAINS cohort (Caspers et al., 2014) is indicated by coloring of areas red (high structural connectivity) to blue (low structural connectivity). Physical coordinates (cursor) for upper (C): –36.095 mm/10.771 mm/12.499 mm; Physical coordinates (cursor) for lower (C): –51.450 mm/–29.050 mm/2.100 mm (https://atlases.ebrains.eu/viewer).

