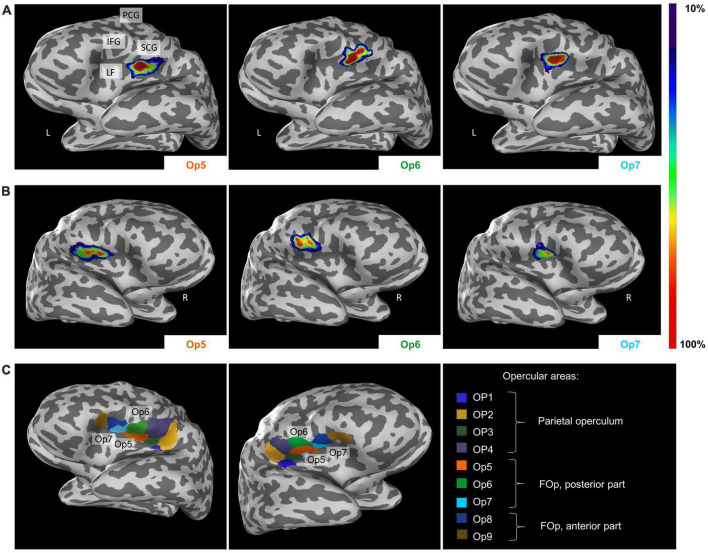
FIGURE 8.
Lateral view from the left (A) and the right side (B) of the cytoarchitectonic probabilistic maps of the delineated areas Op5, Op6, and Op7 (MNI-Colin27 reference space, inflated view, Julich-Brain Atlas https://julich-brain-atlas.de/). The number of overlapping brains per voxel is color-coded. IFG, inferior frontal gyrus; LF, lateral fissure; PCG, precentral gyrus; SCG, subcentral gyrus. (C) Left-hemispheric and right-hemispheric maximum probability maps (MPMs) of areas Op5–Op7 in MNI-Colin27 reference space. The visualization also includes neighboring areas OP1–OP4 and Op8–Op9. Presentation of the MPMs on inflated brains to visualize also areas in sulci.

