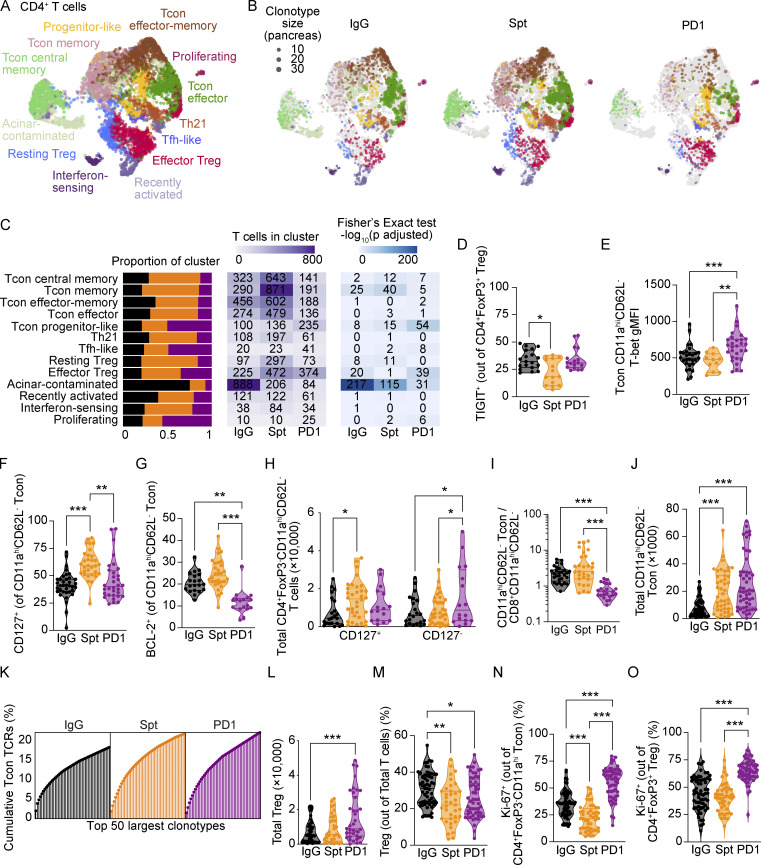
Figure 3.
CD4+ T cells in the pancreas show increased proliferation in anti-PD-1-induced T1D. (A) UMAP visualization of integrated CD4+ T cells detected in the pancreas. Points represent individual cells and colors denote cluster classification as labeled. (B) UMAP visualization of integrated CD4+ T cells detected in the pancreas of each treatment group. Dots represent individual cells with the color representing the cluster classification and size corresponding to the size of the clonotype. Colors denote functional annotations that correspond to the same labels shown in A. (C) Stacked bar plots denoting the percentage of cells from each treatment group within individual clusters (left panel). Heatmap showing the number of cells detected in each cluster and treatment group (middle panel) and −log10 adjusted P values from a Fisher’s exact test (right panel). (D) Violin plots quantifying percent TIGIT+ staining within CD4+FoxP3+ Treg in the pancreas measured by flow cytometry. IgG-Spt, P = 0.0235. (E) Violin plots showing gMFI of T-bet in CD4+FoxP3−CD11ahiCD62L− Tcon in the pancreas by flow cytometry analysis. IgG-PD1, P = 0.0008; Spt-PD1, P = 0.0020. (F) Violin plots quantifying percent CD127+ staining within CD4+FoxP3−CD11ahiCD62L− Tcon in the pancreas measured by flow cytometry. IgG-Spt, P < 0.0001; Spt-PD1, P = 0.0012. (G) Violin plots showing percent BCL-2+ in CD4+FoxP3−CD11ahiCD62L− Tcon in the pancreas by flow cytometry analysis. IgG-PD1, P = 0.0010; Spt-PD1, P < 0.0001. (H) Violin plots quantifying the total number of CD4+FoxP3−CD11ahiCD127+ and CD4+FoxP3−CD11ahiCD127− Tcon detected in the pancreas measured by flow cytometry. For CD127+ Tcon: IgG-Spt P = 0.04. For CD127− Tcon: IgG-PD1 P = 0.04; Spt-PD1, P = 0.04. (I) Ratio of CD4+FoxP3−CD11ahiCD62L− Tcon to CD8+CD11ahiCD62L− T cells in the pancreas measured by flow cytometry. IgG-PD1, P < 0.0001; Spt-PD1, P < 0.0001. (J) Violin plots quantifying the total number of CD4+FoxP3−CD11ahi Tcon detected in the pancreas measured by flow cytometry. IgG-Spt, P = 0.0001; IgG-PD1, P < 0.0001. (K) Plot of the top 50 largest clonotypes, each represented as a line and terminal point, within each treatment group shown as a cumulative total percentage of TCRs detected in Tcon within that treatment group. (L) Violin plots quantifying the total number of CD4+FoxP3+ Treg detected in the pancreas measured by flow cytometry. IgG-PD1, P < 0.0001. (M) Violin plots quantifying the number of CD4+FoxP3+ Treg as a percentage of total TCR-β+ T cells detected in the pancreas. IgG-Spt, P = 0.0012; IgG-PD1, P = 0.0443. (N) Violin plots quantifying percent Ki-67+ staining within CD4+FoxP3−CD11ahiCD62L− Tcon in the pancreas measured by flow cytometry. IgG-Spt, P = 0.0004; IgG-PD1, P < 0.0001; Spt-PD1, P < 0.0001. (O) Violin plots quantifying percent Ki-67+ staining within CD4+FoxP3+ Treg in the pancreas measured by flow cytometry. IgG-PD1, P < 0.0001; Spt-PD1, P < 0.0001. Flow cytometry results are pooled from 3 to 25 independent experiments and significance determined using a non-parametric Kruskall–Wallis test with Dunn’s posthoc test for multiple comparisons. Bars in violin plots represent the first quartile, median, and third quartile. Significant comparisons are indicated with asterisks: *, P < 0.05; **, P < 0.01; ***, P < 0.001.

