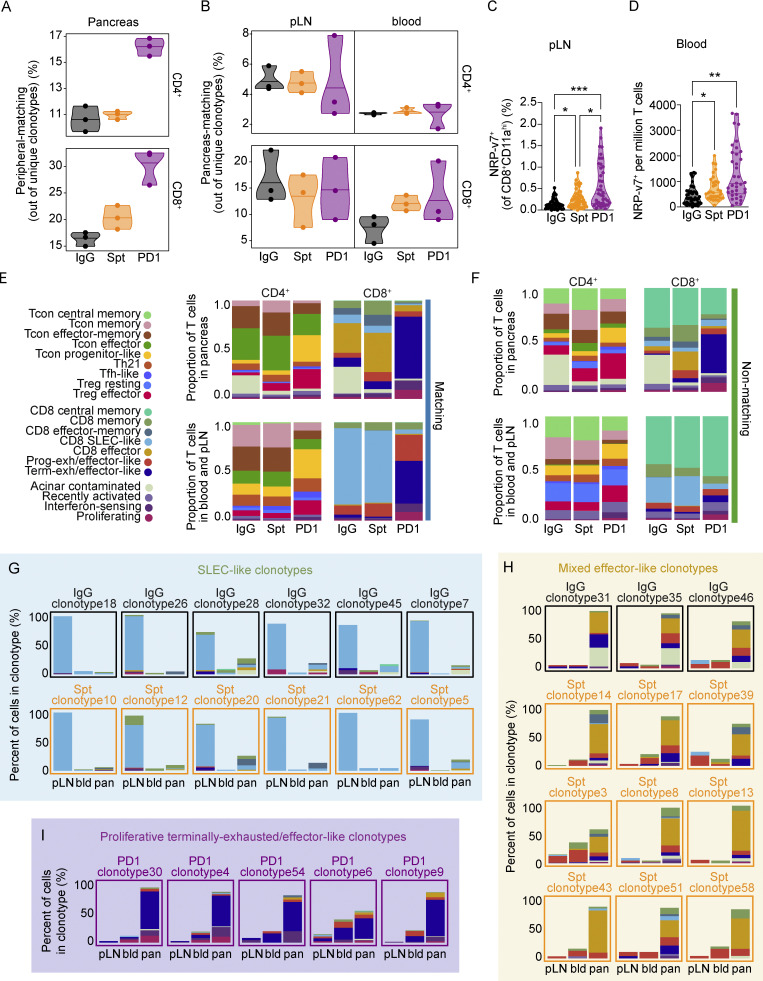
Figure 4.
pLN and blood CD4+ and CD8+ T cells having shared clonality with cells in the pancreas can be identified using the TCR as a barcode. (A) Violin plots showing the percentage of peripheral-matching CD4+ (top) and CD8+ (bottom) clonotypes out of the total unique clonotypes detected in the pancreas. Each dot represents the cells from one individual mouse (n = 3 mice per group). (B) Violin plots showing the percentage of PM CD4+ (top) and CD8+ (bottom) clonotypes out of total unique clonotypes detected in the pLN (left) and blood (right). Each dot represents the cells from one individual mouse (n = 3 mice per group). (C) Violin plots quantifying the percentage of NRP-v7+ CD8+ T cells out of CD8+CD11ahi T cells detected in the pLN measured by flow cytometry. IgG-PD1, P < 0.0001; Spt-PD1, P = 0.0347; IgG-Spt, P = 0.0354. (D) Violin plots quantifying the total number of NRP-v7+ CD8+ T cells per million T cells in the blood measured by flow cytometry. IgG-Spt, P = 0.0287; IgG-PD1, P < 0.0001. (E) Stacked bar plots showing the cluster composition of matching CD4+ and CD8+ T cells across the indicated treatment groups in the pancreas (top) and combined blood and pLN (bottom). (F) Stacked bar plots showing the cluster composition of non-matching CD4+ and CD8+ T cells across the indicated treatment groups in the pancreas (top) and combined blood and pLN (bottom). Legend is shared with E. (G) Stacked bar plots of the percentage of cells detected in clusters within individual SLEC-like clonotypes across pLN, blood (bld), and pancreas (pan). The color of text and border surrounding the stacked bar plot corresponds to the treatment group of the clonotype. (H) Stacked bar plots of the percentage of cells detected in clusters within individual mixed effector-like clonotypes across pLN, blood (bld), and pancreas (pan). The color of the text and border surrounding the stacked bar plot corresponds to the treatment group of the clonotype. (I) Stacked bar plots of the percentage of cells detected in clusters within individual proliferative terminally exhausted/effector-like clonotypes across pLN, blood (bld), and pancreas (pan). (G–I) Legend shared with E. Flow cytometry results are pooled from 3 to 25 independent experiments and significance determined using a non-parametric Kruskall–Wallis test with Dunn’s posthoc test for multiple comparisons. Bars in violin plots represent the first quartile, median, and third quartile. Significant comparisons are indicated with asterisks: *, P < 0.05, **, P < 0.01; ***, P < 0.001.

