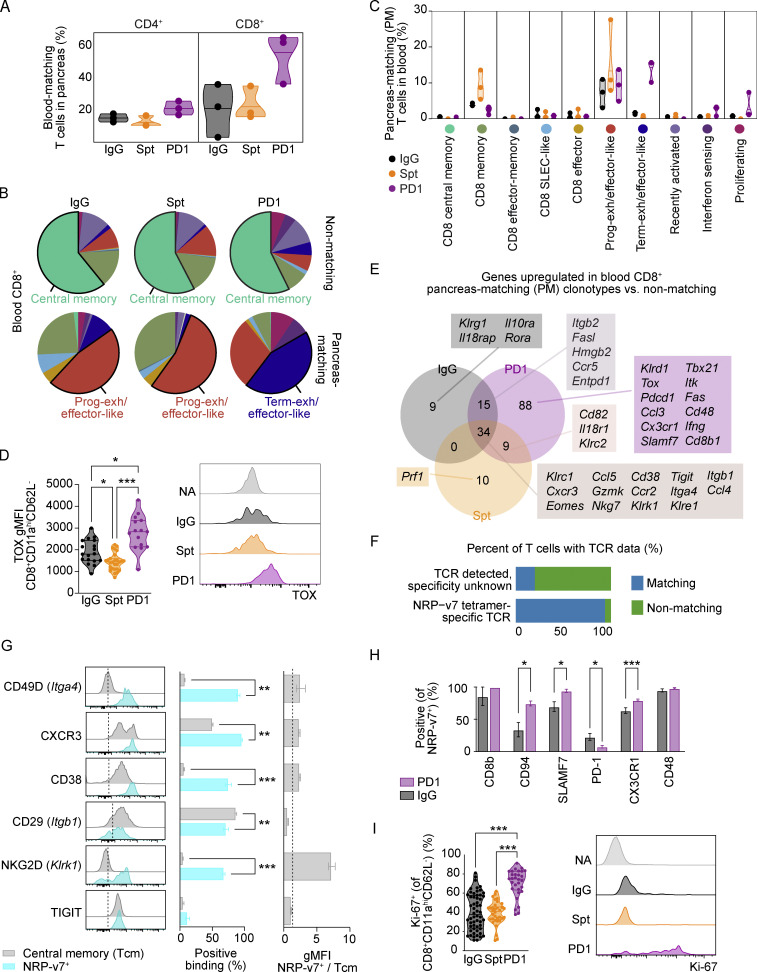
Figure 5.
Circulating blood CD4+ and CD8+ T cells with matching TCRs to pancreatic CD4+ and CD8+ T cells show unique transcriptional features in anti-PD-1-induced T1D compared to spontaneous T1D. (A) Violin plots quantifying the percentage of blood-matching T cells in the pancreas out of all CD4+ (left) or CD8+ (right) T cells. Each dot represents the cells from one individual mouse (n = 3 mice per group). (B) Pie charts displaying the cluster proportions of non-matching (top) and PM (bottom) CD8+ T cells in the blood. The cluster that constitutes the largest proportion is annotated with text. The colors for the pie slices correspond with the clusters identified in Fig. 2 A, and the corresponding names and colors for each cluster are shared with C. (C) Violin plots showing the frequency of PM CD8+ T cells in the blood on a cluster-by-cluster basis, separated by treatment group. The clusters are those that were identified in Fig. 2 A. (D) Violin plots showing gMFI of TOX in CD8+CD11ahiCD62L− T cells in the pancreas by flow cytometry analysis (left). IgG-Spt, P = 0.0393; IgG-PD1, P = 0.0408; Spt-PD1, P < 0.0001. Representative flow cytometry TOX staining on naive (NA; CD8+CD11a−CD62L+) and effector CD8+CD11ahiCD62L− T cells (right) from indicated treatment groups. (E) Venn diagram showing the number of upregulated genes in PM vs. non-PM CD8+ T cells between the three treatment groups. A subset of selected genes within each group is listed. Full list available in Table S5. (F) Bar plot showing the percentage of T cells with known TCR data but with unknown specificity, or TCRs that matched to NRP-v7+ sorted TCR sequences from Gearty et al. (2022). (G) Flow cytometry results of the indicated markers on NRP-v7+ CD8+ T cells and central memory (CD8+CD11ahiCD62L+) T cells in the blood of NOD mice with anti-PD-1-induced T1D. From left to right: Representative flow cytometry histograms; percent positive central memory T cells and NRP-v7+ T cells; and the ratio gMFI of NRP-v7+ over central memory T cells (CD8+CD11ahiCD62L+). Statistical significance determined using a nonparametric Mann–Whitney test with Holm-Sidak’s correction for multiple comparisons. For P values between central memory T cells and NRP-v7+ (middle panel), CD49D P = 0.0023; CXCR3 P = 0.0023; CD38 P < 0.0001; CD29 P = 0.0023, NKG2D P < 0.0001. (H) Bar plots illustrating the positive staining of indicated markers on NRP-v7+ T cells in the blood of anti-PD-1-induced T1D and non-diabetic mice. Significance between PD1 and IgG for the following markers: CD94 P = 0.0277; SLAMF7 P = 0.0202; PD-1 P = 0.0294; CX3CR1 P = 0.0001. (I) Violin plots quantifying percent Ki-67+ staining within CD8+CD11ahiCD62L− T cells in the blood measured by flow cytometry. IgG-PD1, P < 0.0001; Spt-PD1, P < 0.0001. Representative flow cytometry Ki-67 staining on naive (NA; CD8+CD11a−CD62L+) and effector CD8+CD11ahiCD62L− T cells (right). Flow cytometry results are pooled from 3 to 25 independent experiments and significance determined using a non-parametric Kruskall–Wallis test with Dunn’s posthoc test for multiple comparisons. Bars in violin plots represent the first quartile, median, and third quartile. Significant comparisons are indicated with asterisks: *, P < 0.05; **, P < 0.01; ***, P < 0.001.

