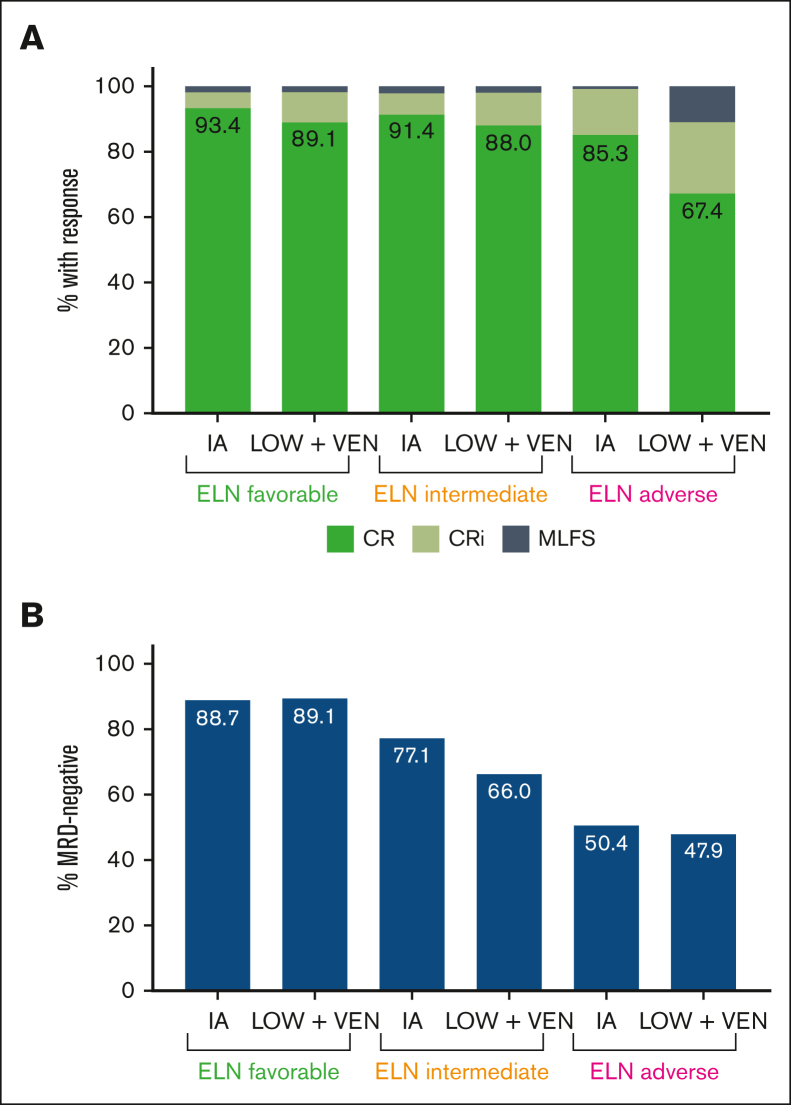
Figure 1.
Responses and MRD negativity rates based on the treatment cohort and ELN risk category. (A) Distribution of responses based on the ELN risk category and treatment cohort. (B) MRD negativity rates based on the ELN risk category and treatment cohort. These figures include responding patients only.

