Figure 6.

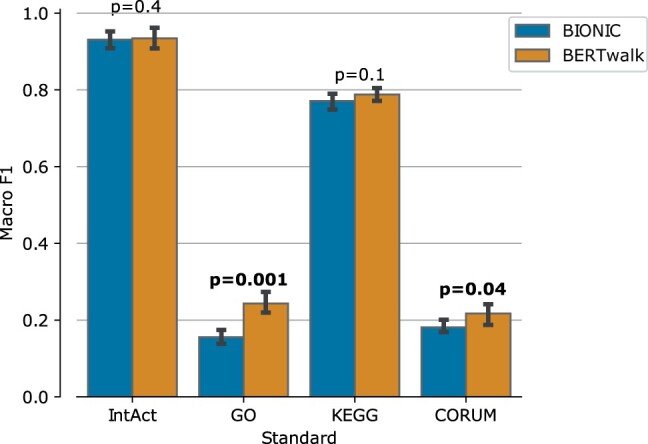
Human gene function prediction performance evaluated by Macro F1 which is the average per-class F1 score (harmonic mean of precision and recall). T-test P-values for performance differences between BERTwalk and BIONIC appear above the bars

Human gene function prediction performance evaluated by Macro F1 which is the average per-class F1 score (harmonic mean of precision and recall). T-test P-values for performance differences between BERTwalk and BIONIC appear above the bars