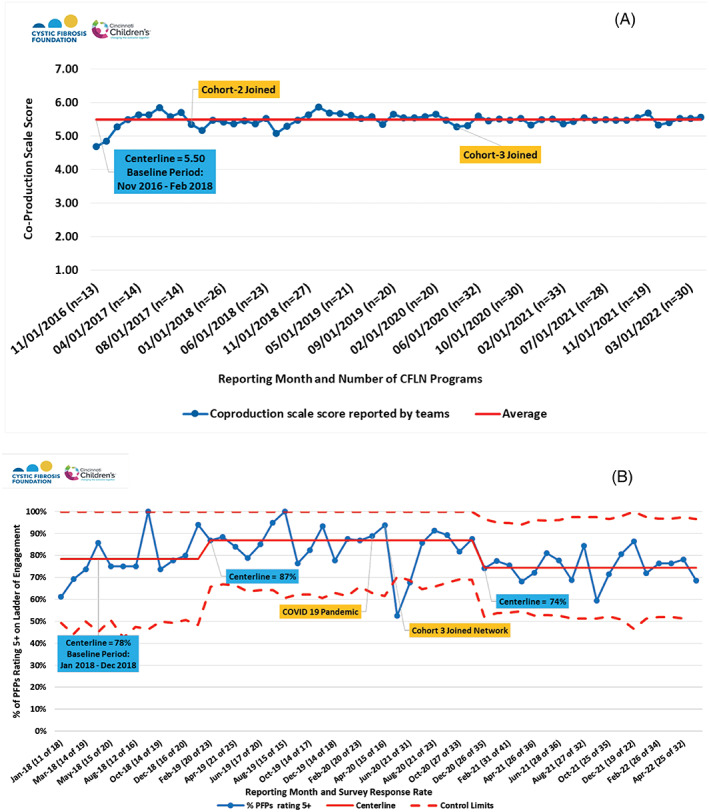
FIGURE 6.

Coproduction scales over time are rated by (A) CFLN programs and (B) patient and family partners (PFPs). Team scores were rated on a scale from 1 to 7, 1 = no PFP involvement and 7 = multiple PFPs taking QI leadership roles. PFP scores rated 1–7, where percent report 5 or higher represent active participation, ownership, or leading QI work. Centerline data is reported in the blue box. Cohorts 2 and 3 were additional waves of recruited centers that joined the original 13 CFLN centers at noted intervals
