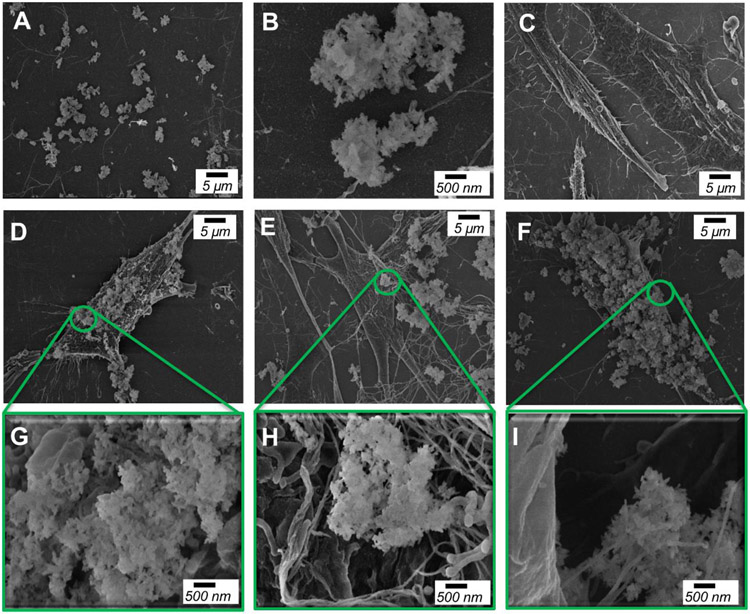
Figure 1. Scanning Electron Microscopy identifies nHAp on cell surface.
SEM analysis of; (A and B) nHAp on collagen-coated silicon chip, (C) untreated cells and (D and G) nHAp-treated BMSCs for 15 minutes, (E and H) 1 hour, and (F and I) 24 hours. G, H, and I are magnified areas of D, E, and F respectively. Scale bars as indicated in the figure.

