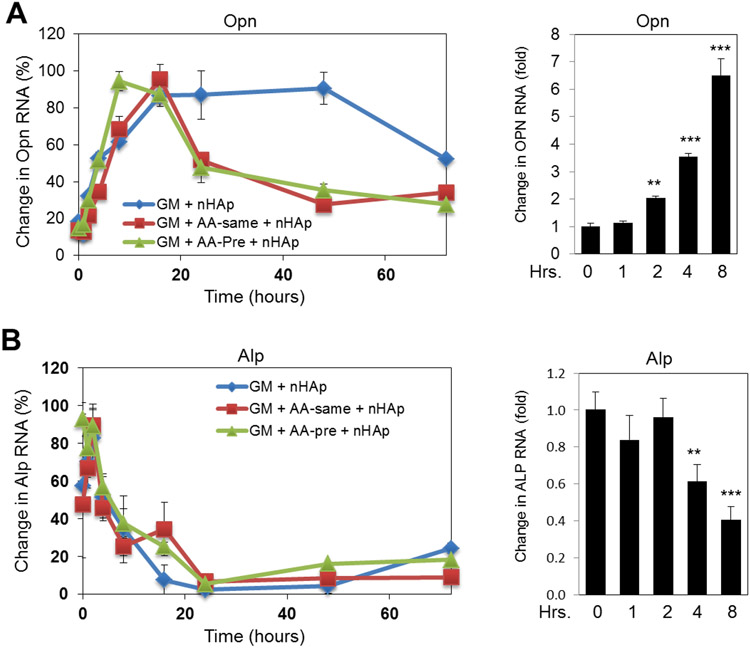
Figure 2. Time course of nHAp stimulated osteopontin and repressed alkaline phosphatase gene expression;
BMSCs were cultured in; growth medium (GM), GM with ascorbic acid (AA) added at the same time as 25 μg/ml of nHAp (AA-same) or 24hrs before nHAp (AA-pre) and RNA was analyzed by qRT-PCR for (A) osteopontin (Opn) or (B) Alkaline phosphatase (Alp) expression levels. Right panels; an expanded graph of early time points calculated as fold change from untreated control. **p<0.005 and ***p<0.0005 (one-way ANOVA).

