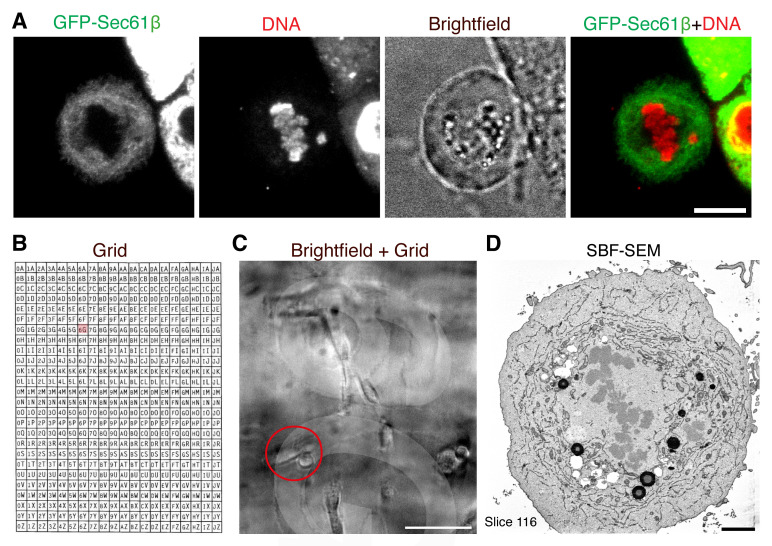
Figure 1. Correlating a cell of interest from light microscopy to electron microscopy.
A. Light microscopy imaging of a cell of interest. A mitotic cell expressing GFP-Sec61β is selected at the desired stage of mitosis and with a misaligned chromosome. Scale bar, 10 μm. B. Layout of photoetched grids on MatTek dishes. C. Low magnification image of the position of the cell on the grid (coord 6G can be seen). Scale bar, 100 μm. D. Resulting serial block-face scanning electron microscopy (SBF-SEM) image following correlation. Scale bar, 2 μm.

