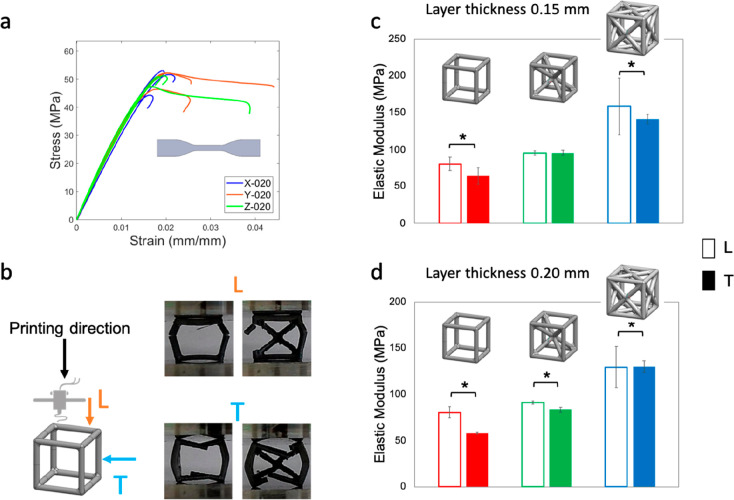
Figure 3.
Effect of the loading vs printing direction on (a) dogbone tensile samples, (b) failure mode (SC vs BCC), (c) cells printed with 0.15 mm thickness layer, and (d) cells printed with 0.20 mm thickness layer. Empty and filled bar indicate L (longitudinal) and T (transversal) loading directions, respectively, vs the printing one. *(p-value <0.05).

