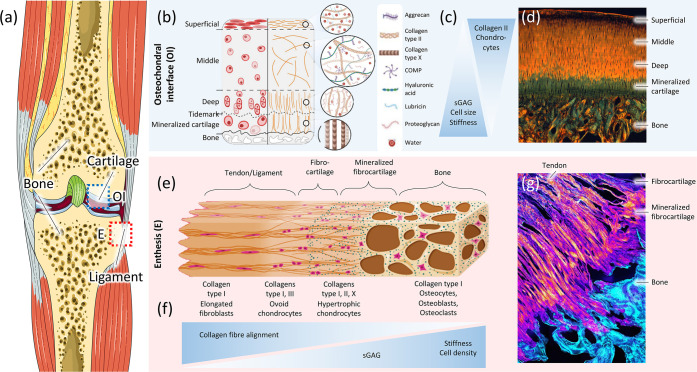
Figure 1.
Structure of bone-to-soft interfaces in the human knee joint. (a) Human knee (from Servier Medical Art) illustrating a blue box for the osteochondral interface (OI) and a red box for the enthesis (E). (b) Schematic of the osteochondral interface divided into the morphology and distribution of the cells (left) and the matrix organization (right) within the different zones in the OI. Panel b is reproduced with permission from ref (72). Copyright 2021 MDPI. (c) Diagram showing the gradients observed in the OI. (d) Histological image of the osteochondral unit showing the different zones in the OI. The subfigure corresponds to a picrosirius red stained sample, imaged with a polarized light filter that shows the collagen distribution (aligned in orange and random in green). Panel d is reproduced with permission from ref (137). Copyright 2021 Elsevier. (e) Schematic of the ligament/tendon interface (enthesis, E) showing the predominant type of collagen and its orientation, and the type and morphology of the cells present in each zone. Panel e is reproduced with permission from ref (83). Copyright 2021 MDPI. (f) Diagram showing the gradients observed in the enthesis. (g) Histological image of the enthesis showing the different zones connecting the tendon and bone. The subfigure corresponds to a fluorescence microscope image showing the fibers of collagen type II in bright orange. Subfigure g is from ph.tum.de/latest/news/tendon-bone-insertion and reproduced with permission from ref (5). Copyright 2021 Nature.

