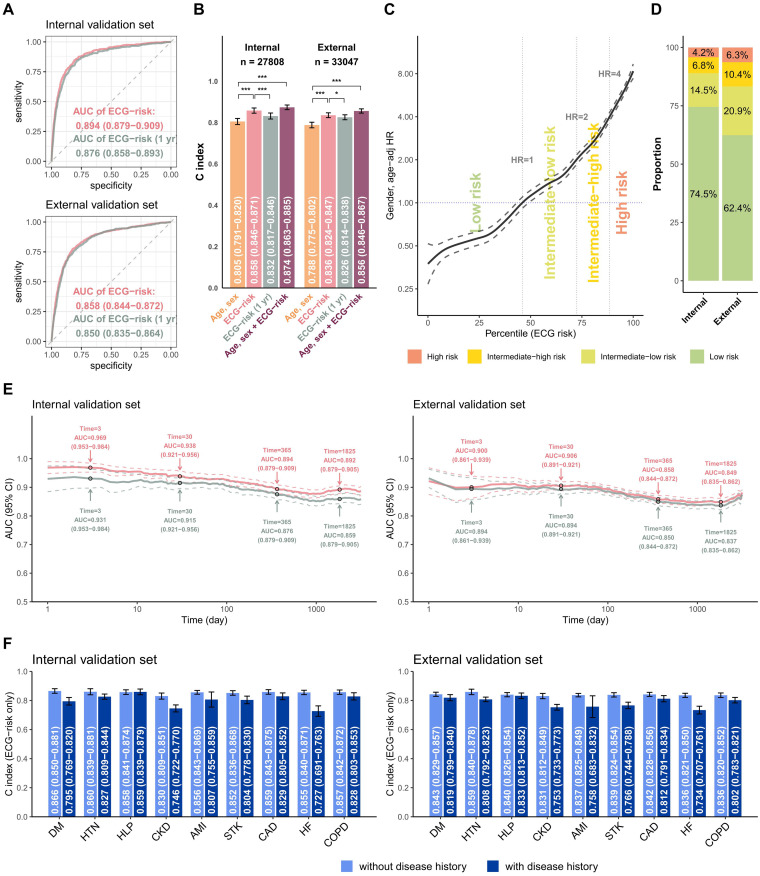
Figure 3.
Summary of model performance for predicting all-cause mortality and the risk stratifications in the internal and external validation sets. (a) ROC curves of the risk prediction based on a deep survival neural network trained by long-term mortality risk (ECG risk) and a deep neural network trained by 1-year mortality risk (ECG risk (1 year)). The cases are the patients who died within 1 year, and the controls are the patients who lived more than 1 year. (b) The C-index for the indicated input data, including (i) age and sex alone, (ii) ECG-risk score based on ECG voltage-time traces alone, (iii) ECG-risk (1 year) score based on ECG voltage-time traces alone, and (iv) ECG-risk score with age and sex. (c) The ECG-risk score is transformed to the percentile scale in risk curve analysis, and we selected an HR of 1 as the operating point to distinguish the low-risk group and intermediate-low-risk group in the tuning set, followed by HRs of 2 and 4 to further stratify the intermediate-high-risk group and high-risk group. (d) According to the operating points decided previously, the patients in the internal and external validation sets were classified into low-risk, intermediate-low-risk, intermediate-high-risk, and high-risk groups for subsequent analyses. (e) Comparing the difference in the AUC between ECG risk and ECG risk (1 year) with varying lengths of follow-up time. (f) Stratified analysis for the C-index of ECG risk on long-term all-cause mortality. *p < 0.05; **p < 0.01; ***p < 0.001.
AMI: acute myocardial infarction; CAD: coronary artery disease; CKD: chronic kidney disease; COPD: chronic obstructive pulmonary disease; DM: diabetes mellitus; ECG: electrocardiogram; HF: heart failure; HTN: hypertension; HR: hazard ratio; ROC: receiver operating characteristic; STK: stroke; AUC: area under the curve.

