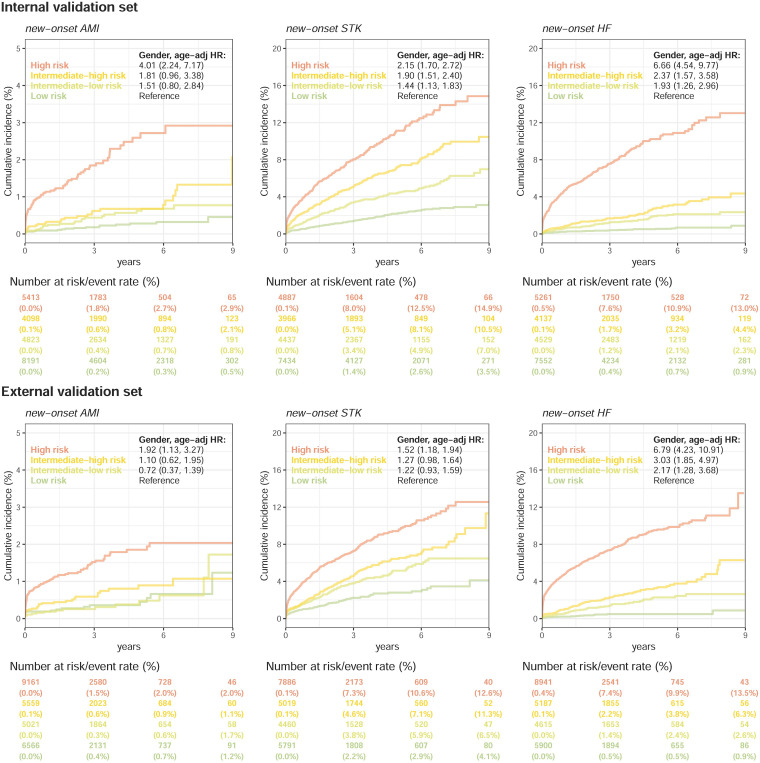
Figure 5.
Kaplan–Meier curves for each risk stratification on new-onset AMI, STK, and HF. The analyses are conducted both in internal and external validation sets. Patients with a history of the corresponding disease were excluded from the analyses. The table shows the at-risk population and cumulative risk for the given time intervals in each risk stratification.
AMI: acute myocardial infarction; STK; stroke; HF: heart failure.

