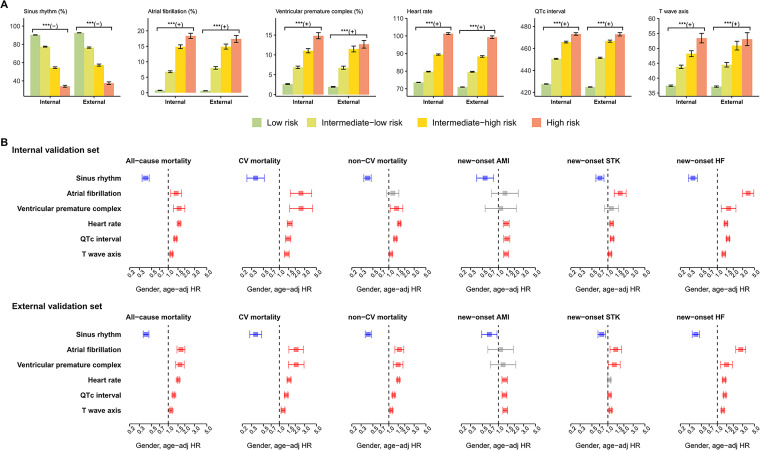
Figure 6.
ECG morphology analysis of risk stratifications on adverse outcomes. (a) Distribution of ECG morphology in each risk stratification. Bars represent the mean or prevalence where appropriate and corresponding 95% confidence intervals (*p < 0.05; **p < 0.01; ***p < 0.001). (b) Risk analysis of selected ECG morphologies on adverse outcomes. Red, gray, and blue bars denote significantly positive, nonsignificant, and negative associations, respectively, with the corresponding outcomes.
AMI: acute myocardial infarction; CV: cardiovascular; ECG: electrocardiogram; HF: heart failure; HR: hazard ratio; STK: stroke.

