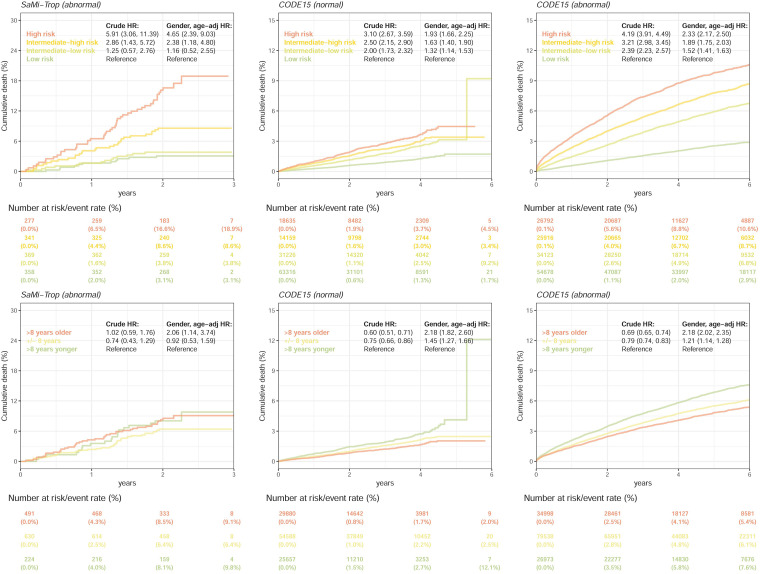
Figure 8.
The mortality prediction performance comparison between our ECG-risk score and the gap in ECG age and chronological age in the SaMi-Trop and CODE15 data sets. All analyses were stratified as “normal” and “abnormal” ECGs. “Normal” refers to the ECGs labeled normal by the original interpreting physician at the time of ECG acquisition, and “abnormal” refers to any ECGs not identified as normal. The HRs summarize the Cox regression models adjusted by different selections of variables. The table shows the at-risk population and cumulative risk for the given time intervals in each risk stratification. We did not perform this analysis in the normal ECGs of SaMi-Trop because most patients had ECG abnormalities related to Chagas disease.
ECG: electrocardiogram; HR: hazard ratio.

