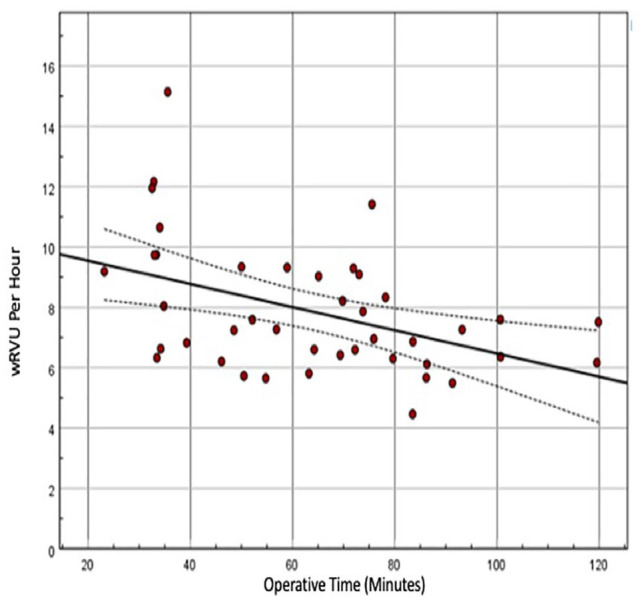
Figure 1.

Scatter plot with linear regression of wRVU/h and operative time.
Note. Each red data point represents an individual Current Procedural Terminology code. Unadjusted linear regression depicting wRVU/h and operative time (solid black line) is y = 10.315 − 0.0384x, x-variable 95% confidence interval (CI): −0.063 to 0.014, P = .003, R2 = 0.196. The 95% CI is visually represented by dotted black lines. This correlates with an hourly decrease in reimbursement of 2.31 wRVU/h or $83.19/h. Multivariate regression of wRVU/h, operative time, and complication rate maintains this relationship: x-variable = −0.037 (95% CI: −0.063 to −0.010), P = .008, and R2 = 0.159. wRVU = work relative value unit.
