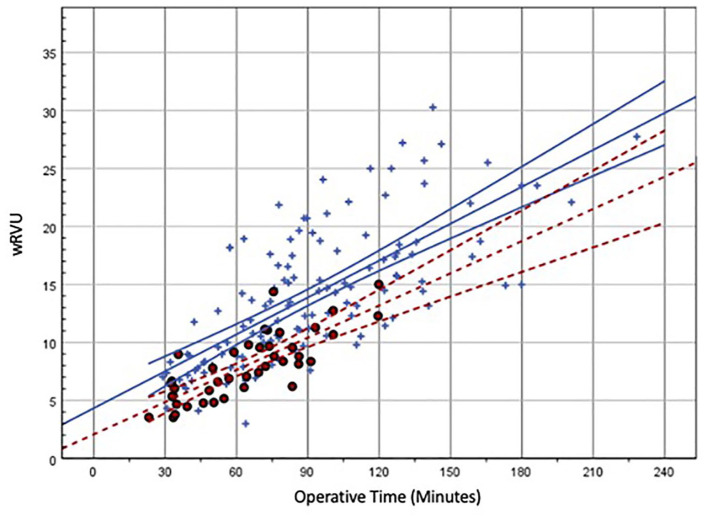
Figure 2.
Scatter plot with linear regressions of wRVU and operative time.
Note. Red circles represent hand Current Procedural Terminology (CPT) codes, and blue crosses represent nonhand CPT codes. Unadjusted linear regression of hand cases depicting wRVU and operative time (red dotted line) is y = 2.073 + 0.093x, P < .001, R2 = 0.627. The 95% confidence interval is visually represented by dotted red lines. Unadjusted linear regression of nonhand cases depicting wRVU and operative time (blue solid line) is y = 4.331 + 0.106x, P < .001, R2 = 0.516. The 95% confidence interval is visually represented by solid blue lines. Multivariate regression of wRVU, operative time, complication rate, and hand versus nonhand CPTs was performed to show that the complication rate does not fully account for different reimbursement rates (P < .001). wRVU = work relative value unit.

