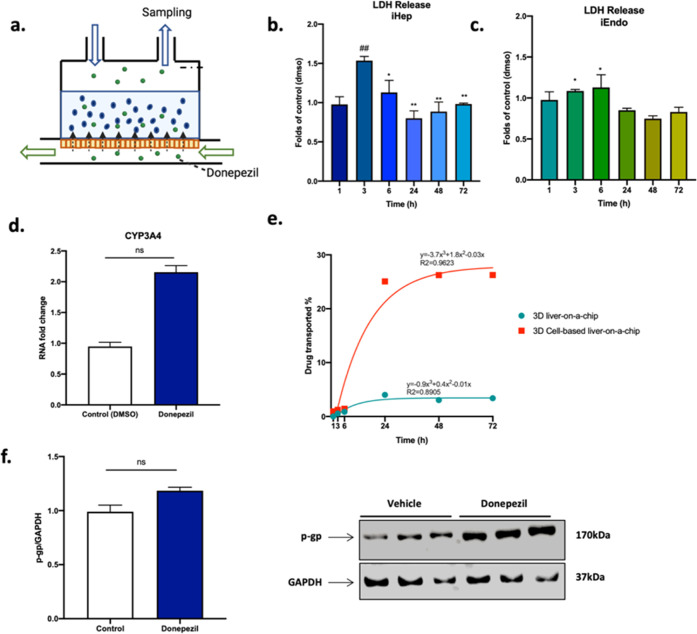
Figure 9.
Effects of donepezil administration in the LoC. (a) Side-view schematic of the LoC in which donepezil is administrated. (b,c) LDH test of iHep and iEndo in perfusion. One-way ANOVA test and Tukey’s multiple comparison post hoc test (b) * = p < 0.05; ** = p < 0.01 vs 3 h; ## = p < 0.01 vs 1 h. (c) * = p < 0.05 vs 48 h. (d) mRNA expression of CYP3A4 of iHep in perfused samples 72 h after drug and DMSO administration. Mann–Whitney U test, p > 0.05. (e) Plot showing donepezil transport either into the 3D LoC alone or hosting cells. (f) Western blot to detect p-gp in the lysates of iHep in perfused samples 72 h after DMSO and drug administration. Mann–Whitney U test, p > 0.05.

