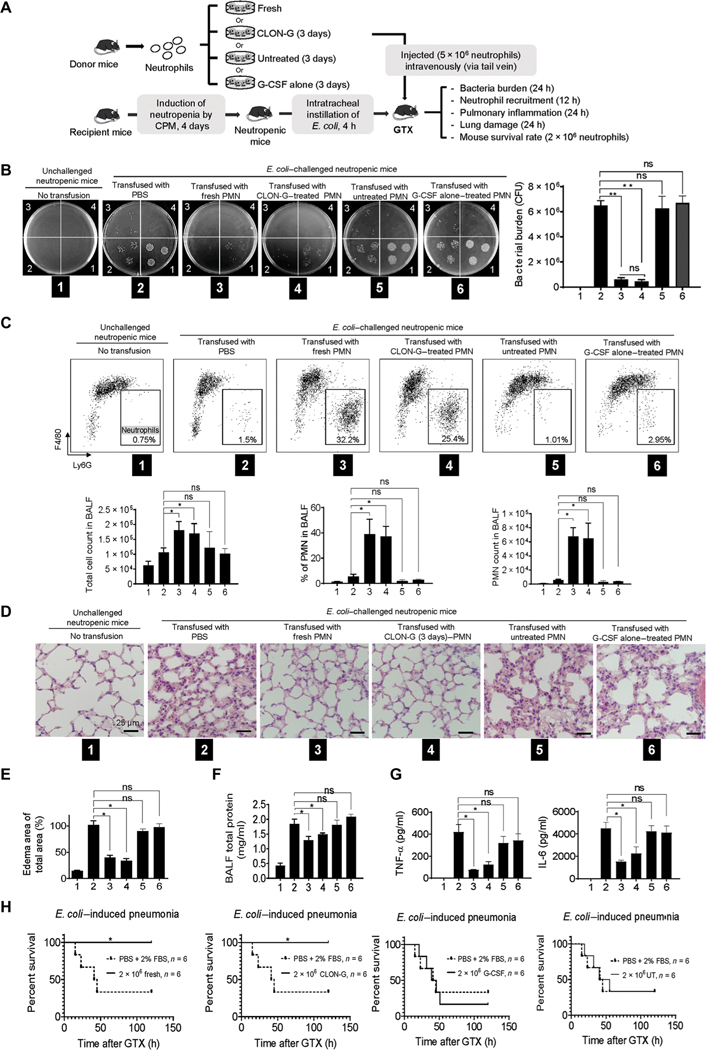
Fig. 5. Transfusion with stored CLON-G–treated neutrophils enhances host defenses and alleviates infection-induced lung damage as effectively as transfusion with untreated fresh neutrophils.
The fresh, untreated, G-CSF alone–treated, and CLON-G–treated neutrophils were prepared as described in Fig. 2D. (A) Neutropenic mice were challenged with E. coli (5 × 10³ CFU) and subsequently received transfer of indicated neutrophil populations. (B) BALF was collected and serially diluted (1, 10× dilution; n, 10n× dilution) with sterile cold water. Aliquots were spread on LB agar plates and incubated overnight at 37°C. Live bacteria were quantified as CFU per lung to determine bacterial killing. Data are presented as means ± SD of three experiments. **P < 0.001. (C) The total number of cells in the lungs was counted with a hemocytometer. Differential cell counts were determined by flow cytometry analysis. Cells were stained with F4/80 FITC and Ly6G APC. The total number of polymorphonuclear neutrophils (PMNs) recruited was calculated as follows: number of PMNs = cell density × volume × % PMN. Data are presented as means (± SD). n ≥ 4 mice in each group. *P < 0.05. (D) Hematoxylin and eosin staining of lung tissues showed pulmonary edema formation in infected lungs. (E) Pulmonary edema formation was quantified as the percentage of edema area in the total parenchymal region using ImageJ software. Data are presented as means ± SD of three experiments. *P < 0.05. (F) Protein accumulation in BALF was measured using a protein assay kit. The standard curve was constructed using bovine serum albumin (BSA). Data are presented as means ± SD of three experiments. *P < 0.05. (G) BALF chemokine and cytokine concentrations were determined by ELISA. Data are presented as means ± SD of three experiments. *P < 0.05. TNF-α, tumor necrosis factor–α. (H) Rate of mortality due to E. coli–induced pneumonia in mice transfused with indicated neutrophil population is shown by a Kaplan-Meier plot. Log-rank tests were used to analyze survival rates. *P < 0.01 as compared to PBS + 2% FBS control treatment.

