

Abstract
Background:
We described here an aptamer-based magnetic nanoprobe for measuring the amount of chloramphenicol (CAP) in milk.
Methods:
The nanoprobe presented in this method consists of a magnetic nanoparticle conjugated to a specific CAP aptamer. If the target is detected in the sample, the nanoprobe binds to it, and the aptamer forms a G-quadruplex structure. This structure mimics the peroxidase activity in the presence of the hemin cofactor. If tetramethylbenzidine is added to the sample containing the nanoprobe, a blue color light is observed. After adding a stop reagent solution, the color produced is measured by a microplate reader and a portable meter.
Results:
This study proves a 99% positive linear relationship between the microplate reader's results and the portable meter results.
Conclusion:
Conjugation of the aptamer to magnetic nanoparticles and applying magnetic separation operations change the nanoprobe performance by 11% for both mentioned devices.
Keywords: Chloramphenicol, G-quadruplex aptamer, MNP, Portable meter
Introduction
Chloramphenicol (CAP), one of the oldest antibacterial agents applied, has a wide range of activity against Gram-positive and Gram-negative bacteria, as well as aerobic and anaerobic bacteria.[1] This antibiotic can also have dangerous side effects, such as bone marrow suppression, which can be fatal or causes aplastic anemia. Particularly in infants, CAP toxicity can cause cyanotic heart disease and cardiovascular collapse, known as “gray syndrome.”[2,3] According to epidemiological studies, CAP is strongly associated with leukemogenesis.[4,5] The apparent risk of anemia and the carcinogenic effects of CAP indicates that its presence in food is unlawful and intolerable. Thus, a sensitive approach for tracking CAP's residues in food samples seems to be quite necessary.
Nowadays, the common approaches used to diagnose CAP can be classified into the laboratory and the non-laboratory methods. Non-laboratory methods for detecting CAP can be fluorescent lateral flow tests and sensors.[6,7] The advantages of non-laboratory methods include independence from the laboratory environment, on-site detection capability, high operating speed, and low cost. Laboratory strategies for the detection of CAP include chromatography techniques such as liquid chromatography (LC), LC-mass spectrometry (MS)/MS, high-performance liquid chromatography, thin-layer chromatography, gas chromatography -MS, and column chromatography.[8,9,10,11,12,13] Alternative laboratory methods for CAP diagnosis include immunoassay techniques such as enzyme-linked immunosorbent assay (ELISA), chemiluminescence immunoassay, and microbiological methods such as agar diffusion.[14,15,16,17]
Aptamers are diagnostic agents based on nucleic acids that have recently attracted much attention.[18] As a matter of fact, aptamers are single-stranded oligonucleotide sequences or DNA/RNA oligomers that bind specifically to the target molecule.[19,20] They are generated through a process called systematic evolution of ligands by exponential enrichment (SELEX).[21] Aptamers can capture various objectives from small molecules such as ochratoxin A and metal ions through organic molecules, proteins, and whole cells.[22,23,24,25] Higher stability, lower production costs, easier synthesis, and labeling without affecting the affinity, all of these are aptamer advantages over antibodies and enzymes.[20] They have the same properties as the previous recognition elements, antibodies, and enzymes, without their disadvantages.
By trapping their target molecule, aptamers can change their structure to a specific folding.[26] After trapping their targets, aptamers with guanine-rich sequences in their structure can change their structure to G-quadruplex form.[27] Unlike the usual connections between DNA bases, guanine-rich nucleic acid sequences can fold in G-quadruplex, a four-stranded secondary structure in which the four guanine bases are connected through the Hoogsteen base pairing in the same plane.[28,29] By adding a specific cofactor, hemin molecule, to the G-quadruplex formed aptamers, a peroxidase activity appears.[30]
In our work [Figure 1], the recognition element is an aptamer that, in addition to its high sensitivity and specificity for detecting CAP, forms a G-quadruplex structure after capturing its target molecule, CAP, present in the sample. Utilizing magnetic nanoparticles in a detection probe and applying a magnetic field eliminates the effect of unwanted factors (such as other biological molecules) present in the sample that may interact in the process, thus reducing the false positive or false negative responses produced.
Figure 1.

Schematic colorimetric measurement of chloramphenicol with the portable meter through the aptamer-based magnetic nanoprobe
Materials and Methods
Reagents and apparatus
The biotin functionalized aptamer was obtained from Bioneer Co. Ltd (South Korea). The Iron oxide magnetic nanoparticles solution was obtained from ChemiCell GmbH (Germany) with a concentration of 10 ng/mL in H2O and average particle sizes of 60–90 nm. The magnetic nanoparticles were streptavidin-coated. The 0.5% CAP solution was obtained from Sina Darou (Iran). The tetramethylbenzidine (TMB) substrate, the stop reagent solution, and the hemin were obtained from Sigma-Aldrich (Germany). The magnesium chloride (MgCl2), Potassium chloride (KCl), Calcium chloride (CaCl2), Sodium chloride (NaCl), and Tris hydrochloride (Tris HCl) were obtained from Merck (Germany). The Accu-Chek® Portable Meter, together with its compatible test strips, was obtained from Roche (Switzerland).
Aptamer Selection and modeling
Functions of G-quadruplex aptamer in our work consist of (i) capturing CAP molecules and (ii) creating HRP mimicking characteristics (peroxidase activity). In this work, the appropriate aptamer to make the detector probe was obtained from the patent issued by Blust et al. This aptamer sequence is as follows:[31]
5'-AGCAGCACAGAGGTCAGATGACTGAGG
GCACGGACAGGAGGGCATGGAGAGATGGCG-3'
The reason for choosing this aptamer was the repeated guanine sequences, the high ability for detecting the CAP molecule, and the aptamer's physical structure.
Evaluation of the performance of selected aptamer for specific binding to chloramphenicol
In order to ensure the peroxidase activity of G-Quadruplex aptamer structure-hemin complex formed after specific binding to CAP, the enzymatic activity of the G-Quadruplex structure was examined in the presence of hemin as a prosthetic group, and TMB/H2O2 as a substrate-chromogen for peroxidase activity. To perform this test, first, a suitable volume of selected aptamer was prepared at a concentration of 2 μM. Then, it was placed at 95°C for 10–15 min until the possible secondary structures formed in the oligomer were removed and the preparation steps were performed on ice. The reaction mixture consisting of selective aptamer at 2 μM and CAP at 0, 1.25, 2.5, 5, 10 (% W/V) and the hemin 1 μM were incubated in the phosphate buffer saline (PBS) as reaction buffer for 30 min at room temperature in constant and continuous shaking. Then, TMB/H2O2 as substrate-chromogenic complex was added to mix and incubated at room temperature with gently shaking for 30 min, and then H2 SO4 as a reaction stop reagent was added to the same volume of TMB/H2O2. The color changes due to the peroxidase activity of the complex in the presence of CAP were evaluated and the adsorption of the reaction solution at 450 nm was determined with a microplate reader and Portable meter.
Detection of chloramphenicol in milk using specific aptamer
In this regard, 15 μl of pasteurized milk with 1.5% fat were poured into five microtubes of 0.2 ml. Subsequently, the CAP was diluted in milk at different concentrations (0, 1.25, 2.5, 5, 10 [% W/V]) in milk and the hemin 1 μM was incubated in the PBS as reaction buffer for 30 min at room temperature in constant and continuous shaking. Zero milk-containing microtube was free of CAP. It represented the excipients' background effect in the reaction and was called nonspecific binding (NSB). Then, TMB/H2O2 as substrate-chromogenic complex was added to mix and incubated at room temperature with gently shaking for 30 min, and then H2 SO4 as a reaction stop reagent was added to the same volume of TMB/H2O2. The color changes due to the peroxidase activity of the complex in the presence of CAP were evaluated and the adsorption of the reaction solution at 450 nm was determined with microplate reader and portable meter.
Detection of chloramphenicol in milk using aptamer-based magnetic nanoprobe
Our magnetic nanoparticles, ranging from 60 to 90 nm and a 10 mg/ml concentration, were coated with streptavidin protein. The streptavidin protein tends to bind to the biotin attached at the end of our oligonucleotide sequence (biotin-labeled). Regarding the conjugation operation, the tube containing magnetic nanoparticles was placed inside a vortex mixer device so that if the nanoparticles had been aggregated, they were dispersed and were regularly distributed in the solution. The magnetic nanoparticles were then mixed with aptamer into a microtube containing the binding buffer. To do so, 5 μl of aptamer and 5 μl of magnetic nanoparticle solution were added into a 0.2 ml microtube containing 10 μl of the binding buffer. The microplate wells were placed in an incubator shaker at 37°C for 15 min to enhance the binding process. Afterward, the CAP aptamers conjugated with magnetic nanoparticles were added to milk-containing microtubes with different CAP concentrations in them. To carry out a washing procedure, the microtubes were placed on a magnet plate to accumulate magnetic nanoparticles at the bottom of the microtubes due to the magnetic field created. The extra solution in each microtube was removed to finally leave 1 μl of the pure mixture of the nanoparticle-aptamer-CAP at the microtubes' bottom (magnetic separation). The hemin solution was then added to all microtubes and put back into the incubator shaker for 15 min at 37°C and 140 rpm. Subsequently, the TMB solution was added to the microtubes and put in the shaker incubator for 15 min with the same settings as before. After observing the color changes, a stop reagent solution was added to microtubes. A microplate reader device and a Accu-Chek® portable meter were used to analyze the results. The microplate reader device was set in absorbance mode, and the 450 nm filter was selected for accomplishing the reading process.
The evaluation criteria
In order to evaluate the results obtained from aptamer and aptamer-based magnetic nanoprobe, the
Pearson correlation coefficient (r) has been used. This criterion is expressed as the following relation:

Where xM and yM are the microplate reader results average and portable meter results average, respectively. Moreover, xG and yM are the individual microplate reader and the portable meter results, respectively. The standard curve trendline slopes were also used to identify nanoparticle conjugation's role in the detection probe's performance through the aptamer and aptamer-based magnetic nanoprobe.
Results and Discussion
Aptamer selected for detection of chloramphenicol in milk
The primary structure of the oligonucleotide sequence of this aptamer was drafted by RNAstructure software [Figure 2]. According to the sequence selection criteria, which include the least amount of dissociation energy (Kd) and the stem-loop structure containing at least 4 consecutive guanines base, the aptamer sequences were investigated. Based on these characteristics, the sequence was selected as a specific aptamer for the detection of CAP.
Figure 2.

Chloramphenicol aptamer structure simulation and by RNAstructure software
Colorimetric performance of the selected aptamer for chloramphenicol detection in buffer
By evaluating the function of the selected oligonucleotide as CAP G-quadruplex aptamer, it was observed that by increasing CAP concentration from well number one to well number five, the blue color intensity would be increasing [Figure 3]. This indicates that the diagnostic method selected in this study was able to identify CAP properly and cause color change based on CAP concentration.
Figure 3.
Evaluation of the selected G-quadruplex aptamer function for mimicking peroxidase activity in the presence of its target and cofactor hemin
Colorimetric performance of the selected aptamer for chloramphenicol detection in milk
The color change results in the milk sample after adding TMB are shown in Figure 4. The results indicated by increasing the concentration of CAP in milk, the color intensity of the reactions was increased.
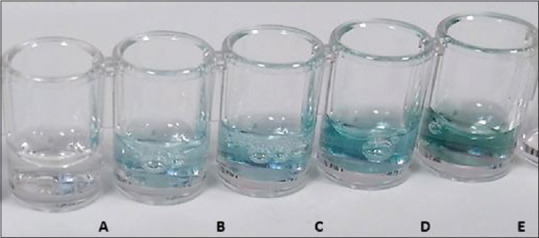
Figure 4.

Colors observed after detecting chloramphenicol in milk sample by aptamer and followed by application of TMB. TMB: Tetramethylbenzidine
The color change results after adding the stop reagent solution are shown in Figure 5. This test was also indicated that the increasing concentrations of CAP could be detected in milk after adding TMB and stop reagent in the each well.
Figure 5.

Colors observed after detecting chloramphenicol in milk sample by aptamer and followed by application of TMB and stop reagent. TMB: Tetramethylbenzidine
Since NSB represents the background effect of the excipients involved in the reaction, its absorption rate can be neglected to determine the exact absorption rate resulting from the diagnosis of CAP. The results displayed on the microplate reader device and the portable management device are presented in Tables 1 and 2.
Table 1.
Results displayed on the microplate reader through aptamer-based detection of chloramphenicol
| Microplate wells | OD 450 nm | Chloramphenicol | |
|---|---|---|---|
|
| |||
| Concentration (ng/µl) | Volume (%) | ||
| A* | 0.00±0.01 | 0 | 0 |
| B | 0.32±0.02 | 62.5 | 1.25 |
| C | 0.48±0.03 | 125 | 2.5 |
| D | 0.57±0.04 | 250 | 5 |
| E | 0.78±0.05 | 500 | 10 |
*NSB. NSB – Nonspecific binding; OD – Optical Density
Table 2.
Results displayed on the portable meter through aptamer-based detection of chloramphenicol
| Microplate wells | Portable meter | Chloramphenicol | |
|---|---|---|---|
|
| |||
| Concentration (ng/µl) | Volume (%) | ||
| A* | 0.0±0.5 | 0 | 0 |
| B | 2.9±1.0 | 62.5 | 1.25 |
| C | 4.4±1.5 | 125 | 2.5 |
| D | 6.5±2.0 | 250 | 5 |
| E | 8.4±2.5 | 500 | 10 |
*NSB. NSB – Nonspecific binding
According to the results mentioned in Tables 1 and 2, standard curves for aptamer-based detection of CAP using microplate reader and portable meter were plotted [Figures 6 and 7].
Figure 6.

Microplate reader results standard curve for aptamer-based detection of chloramphenicol
Figure 7.

Portable meter results standard curve for aptamer-based detection of chloramphenicol
The results for the aptamer-based magnetic nanoprobe for detection of CAP were presented in Tables 3 and 4.
Table 3.
Results displayed on the microplate reader through aptamer-based magnetic nanoprobe detection of chloramphenicol
| Microplate wells | OD 450 nm | Chloramphenicol | |
|---|---|---|---|
|
| |||
| Concentration (ng/µl) | Volume (%) | ||
| A* | 0.00±0.01 | 500 | 10 |
| B | 0.34±0.02 | 250 | 5 |
| C | 0.49±0.03 | 125 | 2.5 |
| D | 0.58±0.04 | 62.5 | 1.25 |
| E | 0.75±0.05 | 0 | 0 |
*NSB. NSB – Nonspecific binding; OD – Optical Density
Table 4.
Results displayed on the portable meter via aptamer-based magnetic nanoprobe detection of chloramphenicol
| Microplate wells | Portable meter | Chloramphenicol | |
|---|---|---|---|
|
| |||
| Concentration (ng/µl) | Volume (%) | ||
| A* | 0.0±0.5 | 500 | 10 |
| B | 3.0±1.0 | 250 | 5 |
| C | 4.5±1.5 | 125 | 2.5 |
| D | 5.5±2.0 | 62.5 | 1.25 |
| E | 8.5±2.5 | 0 | 0 |
*NSB. NSB – Nonspecific binding
According to the results mentioned in Tables 3 and 4, standard curves for the aptamer-based magnetic nanoprobe for detection of CAP were generated [Figures 8 and 9].
Figure 8.

Microplate reader results standard curve for aptamer-based magnetic nanoprobe detection of chloramphenicol
Figure 9.

Portable meter results standard curve for aptamer-based magnetic nanoprobe detection of chloramphenicol
Evaluation of nanoprobe performance through aptamer and aptamer-based magnetic nanoprobe detection of chloramphenicol
By comparing the standard curves for the two cases, free aptamer (when the detection probe has only consisted of the aptamer) and nanoparticle conjugated aptamer (when the detection probe has consisted of the magnetic nanoparticles together with the aptamer), it can be concluded that the trendline slopes of these graphs differ significantly [Table 5]. This indicates that the nanoprobe's performance significantly differs in the free aptamer mode and the nanoparticle conjugated aptamer mode. This comparison is carried out for both the microplate reader device and the portable manager device. Conjugation of the aptamer to magnetic nanoparticles and applying magnetic separation operations changed the nanoprobe performance by about 11% for both devices [Table 6].
Table 5.
Results displayed on both devices for aptamer-based magnetic nanoprobe detection of chloramphenicol
| Subject | OD 450 nm | Portable meter | Pearson correlation coefficient |
|---|---|---|---|
| A | 0.00±0.01 | 0.0±0.5 | |
| B | 0.34±0.02 | 3.0±1.0 | 0.9929 |
| C | 0.49±0.03 | 4.5±1.5 | |
| D | 0.58±0.04 | 5.5±2.0 | |
| E | 0.75±0.05 | 8.5±2.5 |
OD – Optical Density
Table 6.
The difference between two standard curve trend line slopes
| Measurement devices | The standard curve trend line slope | Difference between Case 1 and 2 (%) | |
|---|---|---|---|
|
| |||
| Case 1 | Case 2 | ||
| Microplate reader | 0.0489 | 0.0433 | 11.451 |
| Portable meter | 0.6024 | 0.5357 | 11.072 |
Correlation coefficient analysis
One of the favorite approaches to compare the performance of a new diagnostic test to that of an existing method is to calculate the correlation coefficient.[31,32] This approach is the world's most popular method after the Bland and Altman method.[33] In order to measure the linear correlation between the two results obtained from the microplate reader and the portable management device, the Pearson correlation coefficient is used. The Pearson correlation coefficient values can vary from +1 to –1, where +1 means a perfect positive relationship, –1 indicates a perfect negative relationship, and 0 indicates no relationship exists.[34] The Pearson correlation coefficient result for our observations in aptamer conjugated magnetic nanoparticles mode [Table 5] is 0.9929, which indicates a strong positive linear correlation between microplate reader results and portable meter results.
Conclusions
The purpose of the present research study is to provide an aptasensor-based method for detecting CAP against the deficiencies of the prior art for CAP detection. Aiming at the problems of current CAP detection methods such as high cost, time-consuming and poor reliability, the present nanomolecular method has simple operation, low cost, high sensitivity, portability, and short response time. The advantages of the technology designed are concluded in the following.: (i) one advantage of our proposed method is that only one oligonucleotide strand, the G-quadruplex aptamer, plays the role of the recognition element and the transducer. In other words, the target detection process and the signal production are done only by the G-quadruplex aptamer. This not only makes the process of making the final diagnostic kit easier and cheaper but also increases the manufacturing speed. It is more cost-effective than conventional methods and can be developed as an on-site screening test. Conventional CAP biosensors need a specific transducer agent to produce the signal. For example, in work done by Zijing et al., SYBR Green I, a fluorescent DNA binding dye, is used to produce a fluorescent signal for the quantitative measurement of CAP.[35] These types of fluorescence analysis methods also need a quenching group and a complementary single-stranded DNA fragment to keep the quenching group close to the fluorescent dye. Other conventional CAP biosensors, mostly based on the ELISA method, are laboratory-based and mainly use expensive monoclonal antibodies. (ii) since the similar works to us need a fluorescence spectrophotometer to process the signal, the other advantage for our method is that it does not require some laboratory instruments for processing the signals.[35,36,37] Compared to the previous arts[38,39,40,41] in which the generated signal must be processed by electrochemical impedance spectroscopy, rotational/linear voltammetry, or a potentiostat/galvanostat, the electrical signal from our portable method did not require such laboratory equipment. In this way, the nanobiosensor can be utilized as a portable device to carry out a screening on-site. (iii) another advantage of this research is that it can be generalized and set up for various target molecules. Nevertheless, the newly selected aptamer, which is specific to the new target molecule, must have the ability to form a G-quadruplex structure after capturing the target. (iv) one of the applications of nanotechnology in diagnostic phases is magnetic separation using magnetic nanoparticles. The presence of magnetic iron nanoparticles attached to the detector probe increases the capturing ability of our probe. In this way, when the detector probe is added to the sample solution and shaken, the probe is dispersed throughout it, so they attach to the target molecule, and then, by placing a magnet near the tube containing the mix of sample and probe, the probe attached to the target molecule is concentrated at one point. (v) another innovation of this method is developing a “portable management device,” commonly known as “portable meter” to detect CAP using a specific aptamer and magnetic nanoparticles. The portable manager device processes the signal generated by the transducer and demonstrates it digitally. The term “Portable management device” is derived from a Roche company patent.[42] Depending on the device signal processor, the signal generated by the transducer could be amperometric or colorimetric. For example, Beurer GL 42 Portable Monitor is a portable meter (Beurer GmbH, Germany) uses an amperometric procedure for signal processing; therefore, the transducer performed by us can be set to produce an electrochemical signal in the target's presence. On the other hand, some types of portable monitoring devices deal with the colorimetric assay for signal measuring; accordingly, our transducer has also the capability to produce colorimetric signals in the presence of the target. As another example, the Accu-Chek® Active Portable Meter measures color changes produced on its test strip and processes them by its signal processor. Therefore, by setting our transducer to produce a color change signal in the target's presence, we can also use this type of portable management device as a signal processor. The present method has essential significance for popularizing the aptamer sensor's practical application in environmental issues and other food safety aspects.
Financial support and sponsorship
This research was funded by Vice-Chancellor of Research and Technology, Mazandaran University of Medical Sciences, grant number 5751.
Conflicts of interest
There are no conflicts of interest.
Acknowledgments
We really appreciate the financial support of Mazandaran University of Medical Sciences and the Center for Health Research in Plant and Livestock Products.
References
- 1.Wiest DB, Cochran JB, Tecklenburg FW. Chloramphenicol toxicity revisited: A 12-year-old patient with a brain abscess. J Pediatr Pharmacol Ther. 2012;17:182–8. doi: 10.5863/1551-6776-17.2.182. [DOI] [PMC free article] [PubMed] [Google Scholar]
- 2.Shalit I, Marks MI. Chloramphenicol in the 1980s. Drugs. 1984;28:281–91. doi: 10.2165/00003495-198428040-00001. [DOI] [PubMed] [Google Scholar]
- 3.Pfenning AP, Roybal JE, Rupp HS, Turnipseed SB, Gonzales SA, Hurlbut JA. Simultaneous determination of residues of chloramphenicol, florfenicol, florfenicol amine, and thiamphenicol in shrimp tissue by gas chromatography with electron capture detection. J AOAC Int. 2000;83:26–30. [PubMed] [Google Scholar]
- 4.Traversa G, Menniti-Ippolito F, Da Cas R, Mele A, Pulsoni A, Mandelli F. Drug use and acute leukemia. Pharmacoepidemiol Drug Saf. 1998;7:113–23. doi: 10.1002/(SICI)1099-1557(199803/04)7:2<113::AID-PDS329>3.0.CO;2-9. [DOI] [PubMed] [Google Scholar]
- 5.Yuan ZR, Shi Y. Chloramphenicol induces abnormal differentiation and inhibits apoptosis in activated T cells. Cancer Res. 2008;68:4875–81. doi: 10.1158/0008-5472.CAN-07-6061. [DOI] [PubMed] [Google Scholar]
- 6.Liu T, Xie J, Zhao J, Song G, Hu Y. Magnetic chitosan nanocomposite used as cleanup material to detect chloramphenicol in milk by GC-MS. Food Anal Methods. 2014;7:814–9. [Google Scholar]
- 7.Sakamoto S, Putalun W, Vimolmangkang S, Phoolcharoen W, Shoyama Y, Tanaka H, et al. Enzyme-linked immunosorbent assay for the quantitative/qualitative analysis of plant secondary metabolites. J Nat Med. 2018;72:32–42. doi: 10.1007/s11418-017-1144-z. [DOI] [PMC free article] [PubMed] [Google Scholar]
- 8.Chen H, Ying J, Chen H, Huang J, Liao L. LC determination of chloramphenicol in honey using dispersive liquid-liquid microextraction. Chromatographia. 2008;68:629–34. [Google Scholar]
- 9.Posyniak A, Zmudzki J, Niedzielska J. Evaluation of sample preparation for control of chloramphenicol residues in porcine tissues by enzyme-linked immunosorbent assay and liquid chromatography. Anal Chim Acta. 2003;483:307–11. [Google Scholar]
- 10.Mottier P, Parisod V, Gremaud E, Guy PA, Stadler RH. Determination of the antibiotic chloramphenicol in meat and seafood products by liquid chromatography-electrospray ionization tandem mass spectrometry. J Chromatogr A. 2003;994:75–84. doi: 10.1016/s0021-9673(03)00484-9. [DOI] [PubMed] [Google Scholar]
- 11.Wan J, Shi L, Guo P, Zhu J, Zhu C, Lu X, et al. Liquid Chromatography-Tandem Mass Spectrometry Method for Residual Quantity of Chloramphenicol in Milk Powder. CN. Patent No. CN103336064A. 2013 [Google Scholar]
- 12.Ashton M. HPLC determination of chloramphenicol, chloramphenicol monosuccinate and chloramphenicol glucuronide in biological matrices. J Liq Chromatogr. 1989;12:1719–32. [Google Scholar]
- 13.Allen EH. Review of chromatographic methods for chloramphenicol residues in milk, eggs, and tissues from food-producing animals. J Assoc Off Anal Chem. 1985;68:990–9. [PubMed] [Google Scholar]
- 14.Impens S, Reybroeck W, Vercammen J, Courtheyn D, Ooghe S, De Wasch K, et al. Screening and confirmation of chloramphenicol in shrimp tissue using ELISA in combination with GC-MS2 and LC-MS2. Anal Chim Acta. 2003;483:153–63. [Google Scholar]
- 15.Sai N, Chen Y, Liu N, Yu G, Su P, Feng Y, et al. A sensitive immunoassay based on direct hapten coated format and biotin-streptavidin system for the detection of chloramphenicol. Talanta. 2010;82:1113–21. doi: 10.1016/j.talanta.2010.06.018. [DOI] [PubMed] [Google Scholar]
- 16.Lin S, Han SQ, Liu YB, Xu WG, Guan GY. Chemiluminescence immunoassay for chloramphenicol. Anal Bioanal Chem. 2005;382:1250–5. doi: 10.1007/s00216-005-3273-6. [DOI] [PubMed] [Google Scholar]
- 17.de Louvois J. Factors influencing the assay of antimicrobial drugs in clinical samples by the agar plate diffusion method. J Antimicrob Chemother. 1982;9:253–65. doi: 10.1093/jac/9.4.253. [DOI] [PubMed] [Google Scholar]
- 18.Rafati A, Zarrabi A, Abediankenari S, Aarabi M, Gill P. Sensitive colorimetric assay using insulin G-quadruplex aptamer arrays on DNA nanotubes coupled with magnetic nanoparticles. R Soc Open Sci. 2018;5:171835. doi: 10.1098/rsos.171835. [DOI] [PMC free article] [PubMed] [Google Scholar]
- 19.Wang M, Mao Z, Kang TS, Wong CY, Mergny JL, Leung CH, et al. Conjugating a groove-binding motif to an Ir (iii) complex for the enhancement of G-quadruplex probe behavior. Chem Sci. 2016;7:2516–23. doi: 10.1039/c6sc00001k. [DOI] [PMC free article] [PubMed] [Google Scholar]
- 20.Zuo P, Li X, Dominguez DC, Ye BC. A PDMS/paper/glass hybrid microfluidic biochip integrated with aptamer-functionalized graphene oxide nano-biosensors for one-step multiplexed pathogen detection. Lab Chip. 2013;13:3921–8. doi: 10.1039/c3lc50654a. [DOI] [PMC free article] [PubMed] [Google Scholar]
- 21.Ellington AD, Szostak JW. In vitro selection of RNA molecules that bind specific ligands. Nature. 1990;346:818–22. doi: 10.1038/346818a0. [DOI] [PubMed] [Google Scholar]
- 22.Cruz-Aguado JA, Penner G. Determination of ochratoxin a with a DNA aptamer. J Agric Food Chem. 2008;56:10456–61. doi: 10.1021/jf801957h. [DOI] [PubMed] [Google Scholar]
- 23.Niu S, Lv Z, Liu J, Bai W, Yang S, Chen A. Colorimetric aptasensor using unmodified gold nanoparticles for homogeneous multiplex detection. PLoS One. 2014;9:e109263. doi: 10.1371/journal.pone.0109263. [DOI] [PMC free article] [PubMed] [Google Scholar]
- 24.Cox JC, Ellington AD. Automated selection of anti-protein aptamers. Bioorg Med Chem. 2001;9:2525–31. doi: 10.1016/s0968-0896(01)00028-1. [DOI] [PubMed] [Google Scholar]
- 25.Duan N, Ding X, He L, Wu S, Wei Y, Wang Z. Selection, identification and application of a DNA aptamer against Listeria monocytogenes. Food Control. 2013;33:239–43. [Google Scholar]
- 26.Wang B, Chen Y, Wu Y, Weng B, Liu Y, Lu Z, et al. Aptamer induced assembly of fluorescent nitrogen-doped carbon dots on gold nanoparticles for sensitive detection of AFB1. Biosens Bioelectron. 2016;78:23–30. doi: 10.1016/j.bios.2015.11.015. [DOI] [PubMed] [Google Scholar]
- 27.Li T, Dong S, Wang E. G-quadruplex aptamers with peroxidase-like DNAzyme functions: Which is the best and how does it work? Chem Asian J. 2009;4:918–22. doi: 10.1002/asia.200900019. [DOI] [PubMed] [Google Scholar]
- 28.Moon J, Han JH, Kim DY, Jung MJ, Kim SK. Effects of deficient of the Hoogsteen base-pairs on the G-quadruplex stabilization and binding mode of a cationic porphyrin. Biochem Biophys Rep. 2015;2:29–35. doi: 10.1016/j.bbrep.2015.03.012. [DOI] [PMC free article] [PubMed] [Google Scholar]
- 29.Chen Y, Yang D. Sequence, stability, and structure of G-quadruplexes and their interactions with drugs. Curr Protoc Nucleic Acid Chem. 2012;17:17–43. doi: 10.1002/0471142700.nc1705s50. [DOI] [PMC free article] [PubMed] [Google Scholar]
- 30.Travascio P, Li Y, Sen D. DNA-enhanced peroxidase activity of a DNA-aptamer-hemin complex. Chem Biol. 1998;5:505–17. doi: 10.1016/s1074-5521(98)90006-0. [DOI] [PubMed] [Google Scholar]
- 31.Morgan CJ, Aban I. Methods for evaluating the agreement between diagnostic tests. J Nucl Cardiol. 2016;23:511–3. doi: 10.1007/s12350-015-0175-7. [DOI] [PubMed] [Google Scholar]
- 32.Zaki R, Bulgiba A, Nordin N, Azina Ismail N. A systematic review of statistical methods used to test for reliability of medical instruments measuring continuous variables. Iran J Basic Med Sci. 2013;16:803–7. [PMC free article] [PubMed] [Google Scholar]
- 33.Fay MP. Random marginal agreement coefficients: Rethinking the adjustment for chance when measuring agreement. Biostatistics. 2005;6:171–80. doi: 10.1093/biostatistics/kxh027. [DOI] [PubMed] [Google Scholar]
- 34.Mukaka MM. Statistics corner: A guide to appropriate use of correlation coefficient in medical research. Malawi Med J. 2012;24:69–71. [PMC free article] [PubMed] [Google Scholar]
- 35.Zijing L, Peng W, Xiang D, Weiwei X, Kun Z. Kit for Quantitatively Detecting Chloramphenicol Based on Bicolor Fluorescence Analysis Method and Method. CN Patent No. CN111505266A. 2020 [Google Scholar]
- 36.Zijing L, Peng W, Dongshan X, Weiwei X, Kun Z. Method for Synchronous Fluorescence Detection of Chloramphenicol Based on Cu/UiO-66 Metal Organic Framework Quenching. CN Patent No. CN111398235A. 2020 [Google Scholar]
- 37.Wu S, Zhang H, Shi Z, Duan N, Fang CC, Dai S, et al. Aptamer-based fluorescence biosensor for chloramphenicol determination using upconversion nanoparticles. Food Control. 2015;50:597–604. [Google Scholar]
- 38.Blust RJ, Dardenne F, De Wael K, Nagels L, Van camp GF. Electrochemical Aptasensors with a Gelatin B Matrix. W. O. Patent No. WO/2015/001050. 2015 [Google Scholar]
- 39.Guosong L, Shun L, Aimin Y, Haili Z. Electrochemical Aptamer Sensor for Rapid Detection of Chloramphenicol. CN Patent No. CN106198695A. 2016 [Google Scholar]
- 40.Lulu C, Yingchun F, Yanbin L. Magnetic Separation-Signal Amplification Integrated Chloramphenicol Detection Biosensor and Method. CN Patent No. CN107037109A. 2017 [Google Scholar]
- 41.He B, Wang S, Wei M, Zhao W, Jin H, Ren W, et al. Preparation Method of Electrochemical Sensor for Chloramphenicol Content Detection. CN Patent No. CN111398394A. 2020 [Google Scholar]
- 42.Henning G. Portable Management and Interface Systems and Methods. WO Patent No. WO2011000528A1. 2011 [Google Scholar]