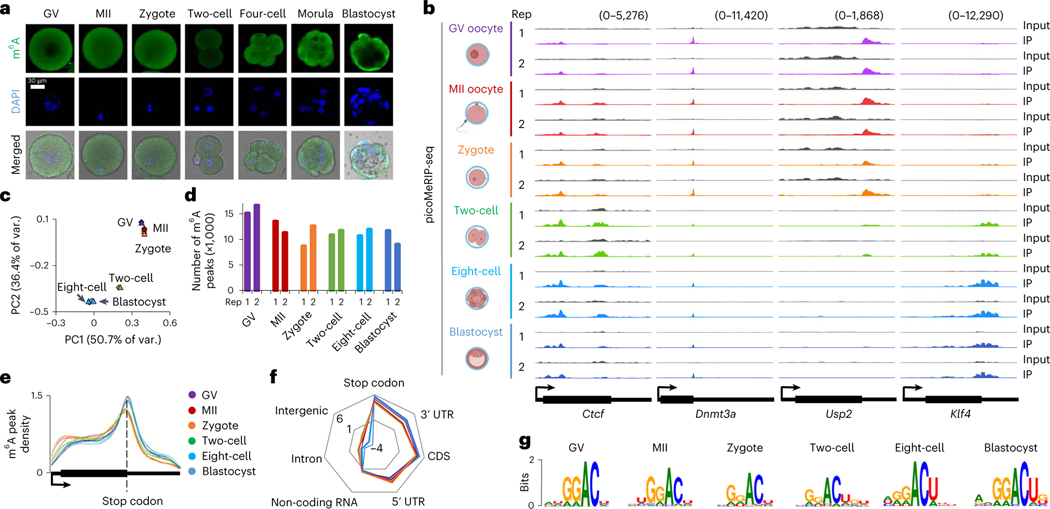
Fig. 1 |. RNA m6A landscapes of mouse oocytes and embryos.
a, m6A immunofluorescence staining. Experiments were repeated three times. b, Genome browser snapshot of picoMeRIP-seq read density in exonic regions of representative gene transcripts for the indicated oocyte and embryo stages. The oocyte and embryo cartoons were created with BioRender.com. c, PCA on 12 picoMeRIP-seq experiments from indicated oocyte and embryo stages. d, Number of m6A peaks. e, Metagene profiles of m6A peak distribution. f, Relative enrichment of m6A peaks for indicated genomic features. For each feature, the enrichment score was calculated as the log2 ratio of the observed over expected peak numbers. The colors of samples are the same as those in e. g, Consensus motifs on m6A peaks identified in biological replicate 1.

