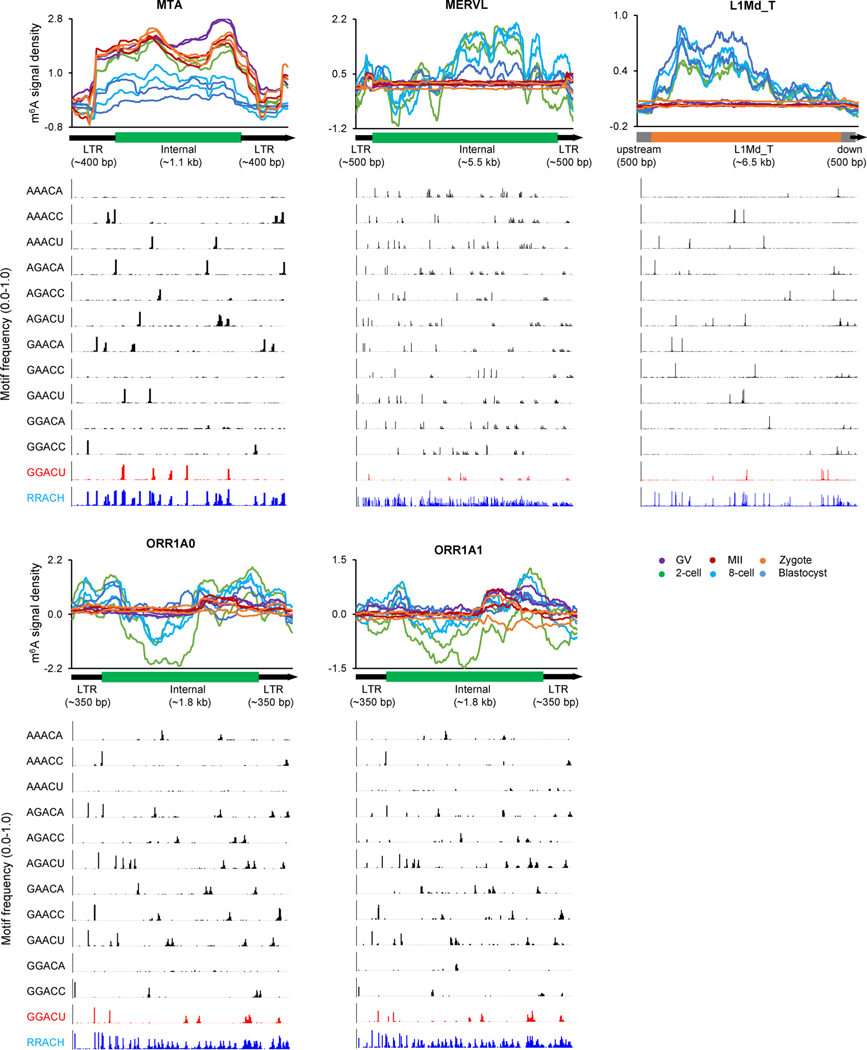
Extended Data Fig. 7 |. m6A signal density and motif distributions along the full-length retrotransposon subfamilies.
For each of 5 subfamilies, the upper panels show m6A signal density pileups generated using the uniquelyaligned reads together with the randomly-assigned multiply-aligned reads. See ‘Methods’ for more details about the random assignment of multiply-aligned reads. The lower bar plots show the frequency (bin size = 10 bp) of RRACH motifs across all copies/loci along the full-length structure.

