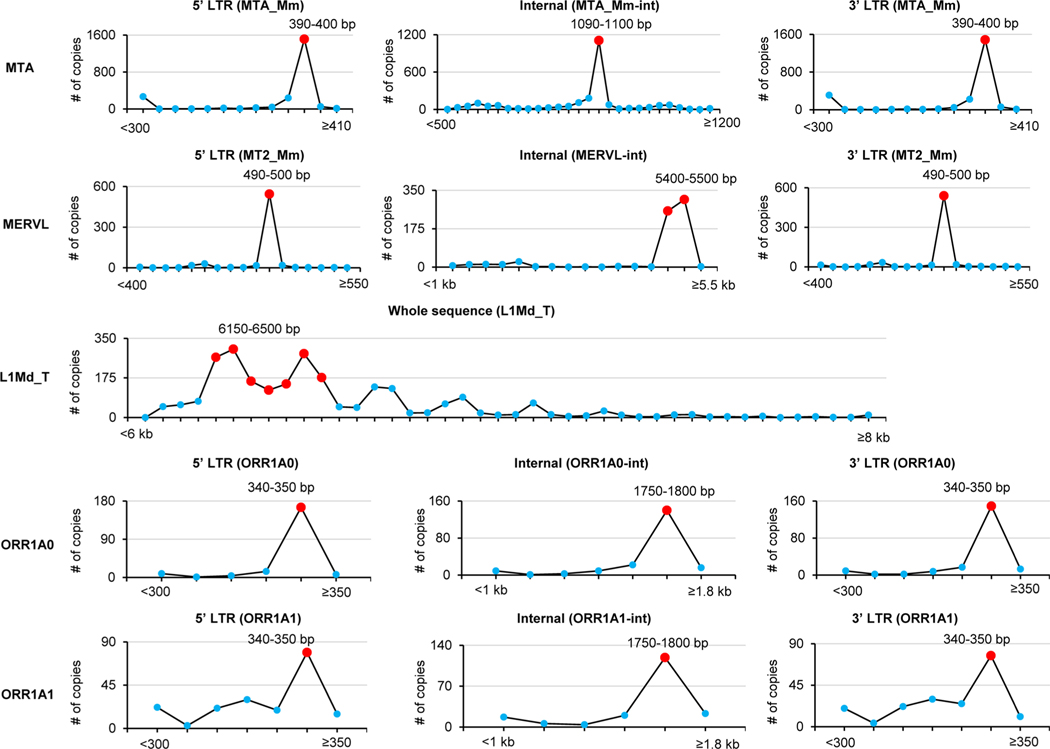
Extended Data Fig. 8 |. Length distribution of genomic copies of 5 subfamilies.
Statistics of lengths of all genomic copies for each subfamily. The length distributions were used as the cutoff to define the full-length MTA, MERVL and L1Md_T (Fig. 4d; Extended Data Fig. 7), as well as ORR1A0 and ORR1A1 (Extended Data Figs. 6b and 7) for plotting the m6A signal density pileups. In brief, for a given locus/copy, we defined it as full-length if the lengths of each part (5′ LTR, internal and 3′ LTR) were in the ranges indicated by the red colored balls which represent the most frequent lengths. See ‘Methods’ for more details.

