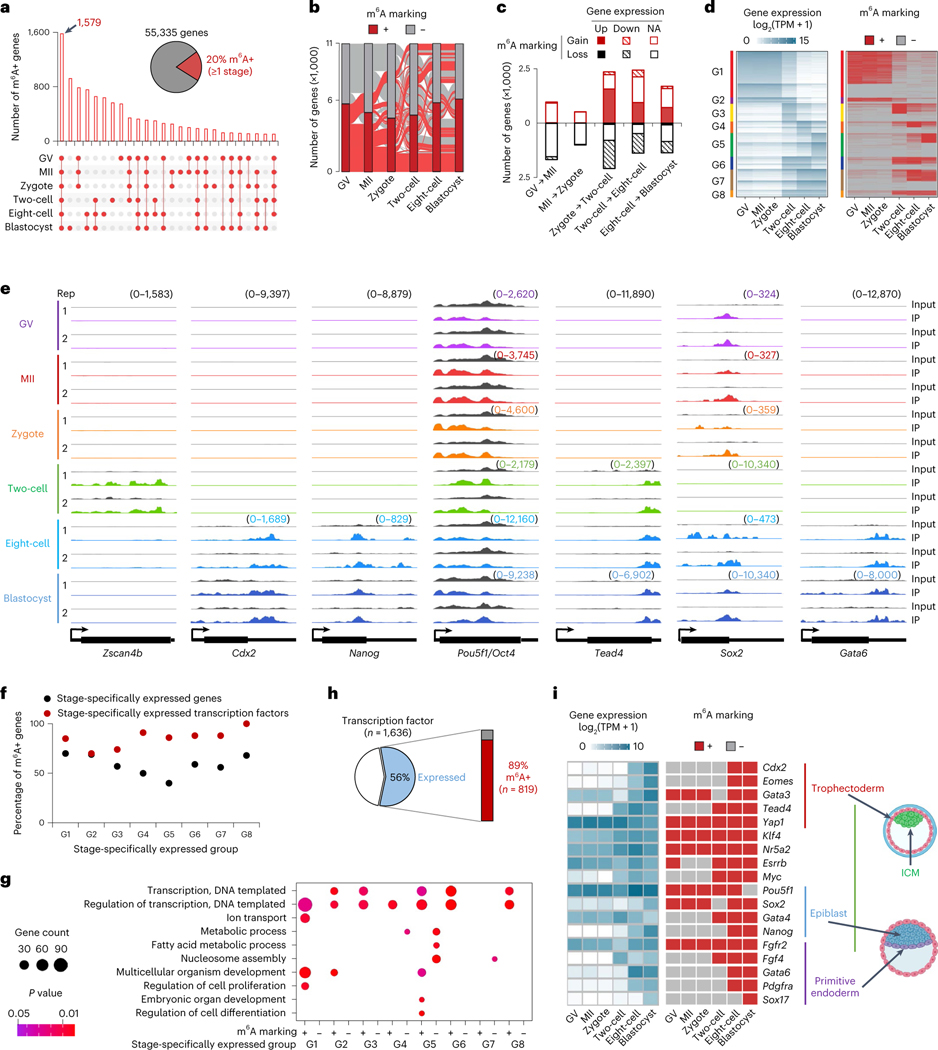
Fig. 2 |. Characterization of m6A methylome dynamics during development.
a, Overview of shared and unique m6A marked (m6A+) genes for the indicated oocyte and embryo stages. b, Alluvial plot showing the dynamics in m6A marked genes between indicated oocyte and embryo stages. c, Genes gaining and losing m6A marking versus change in gene expression between consecutive oocyte and embryo stages. Each gene is denoted as Up, if the log2 of expression fold change of one stage versus the next is >1; Down, if <−1; NA, otherwise. d, Left: heat map of stage-specifically expressed genes categorized into eight major groups. Right: representation of genes marked by m6A or not in comparison with stage-specific expression. e, Genome browser snapshots of picoMeRIP-seq read density in exonic regions of the two-cell specifically expressed gene Zscan4b, and selected genes important to various stages of embryo development. The sample-specific scale ranges are indicated in brackets with the corresponding colors. f, Fractions of m6A marked genes within expressed genes (black dots), and within expressed transcription factors (red dots), respectively, at each stage-specifically expressed group (G1–G8 defined in d). Chi-squared test was performed to calculate the statistical significance (P values 2.9 × 10⁻⁴, 0.99, 1.2 × 10⁻², 7.4 × 10⁻⁷, 2.1 × 10⁻¹¹, 1.1 × 10⁻⁴, 2.0 × 10⁻⁵ and 1.7 × 10⁻⁴ for G1–G8, respectively) of m6A enrichment in expressed transcription factors versus the other expressed genes. g, GO analyses of genes marked (m6A+) or not marked (m6A−) by m6A. Stage-specifically expressed groups defined in d. Fisher’s exact test was used to calculate the one-sided P values. h, Fraction of all transcription factors that are expressed in oocytes or embryos and marked by m6A at ≥1 stage. i, Expression and m6A marking status of genes essential for the first and second lineage specification events in mouse early embryos. The embryo cartoons were created with BioRender.com.

