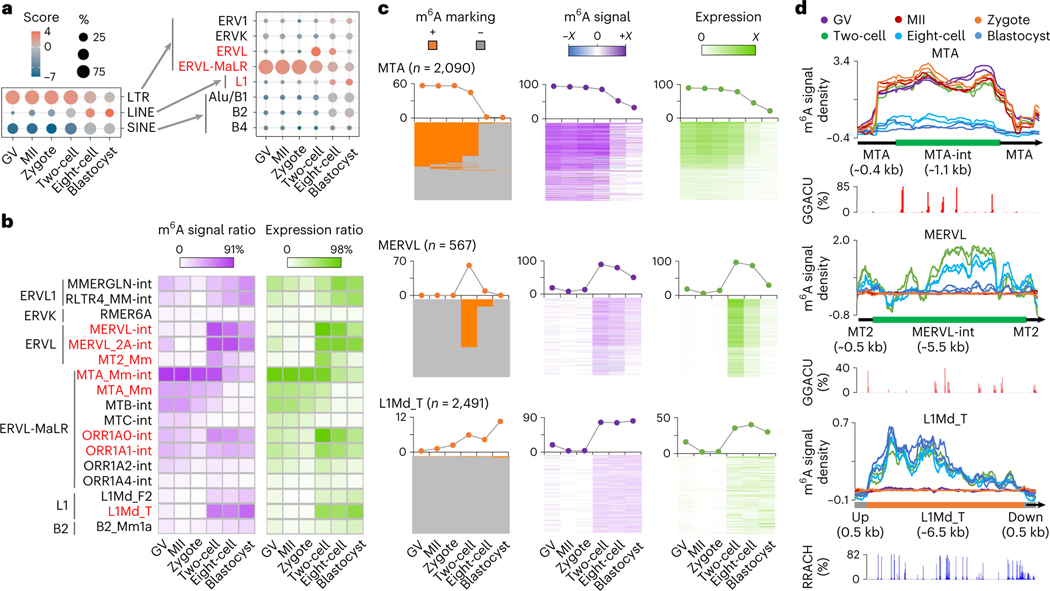
Fig. 4 |. m6A deposition on retrotransposon-derived RNAs.
a, Relative enrichment of m6A peaks (identified in biological replicate 1) in eight major families from three types of retrotransposon. The enrichment score was calculated as the log2 ratio of the observed over expected peak numbers. b, Heat map plots showing the ratios of genomic copies/loci with >0 m6A signal score (MeRIP versus Input) and >0 expression value (RPKM), respectively (calculated using biological replicate 1), for representative retrotransposon subfamilies. c, m6A marking status, m6A signal and expression profiles across the loci of MTA, MERVL and L1Md_T. For MTA and MERVL, only the internal sequences were considered. The line plots above the heat maps show the percentages of loci with m6A+ (that is, overlap with m6A peaks, left), >0 m6A signal value (middle), >0 expression value (right), respectively. Color range of m6A signal: MTA, −4.9 to 7.2; MERVL, −0.7 to 3.9; L1Md_T, −1.1 to 1.8. Color range of expression (that is, averaged log2(RPKM)): MTA, 0 to 12; MERVL, 0 to 8; L1Md_T, 0 to 2. d, m6A signal density pileups along the full-length MTA, MERVL and L1Md_T loci. The lower bar plots show the frequency (bin size 10 bp) of GGACU or RRACH motifs across all loci along the full-length structure.

