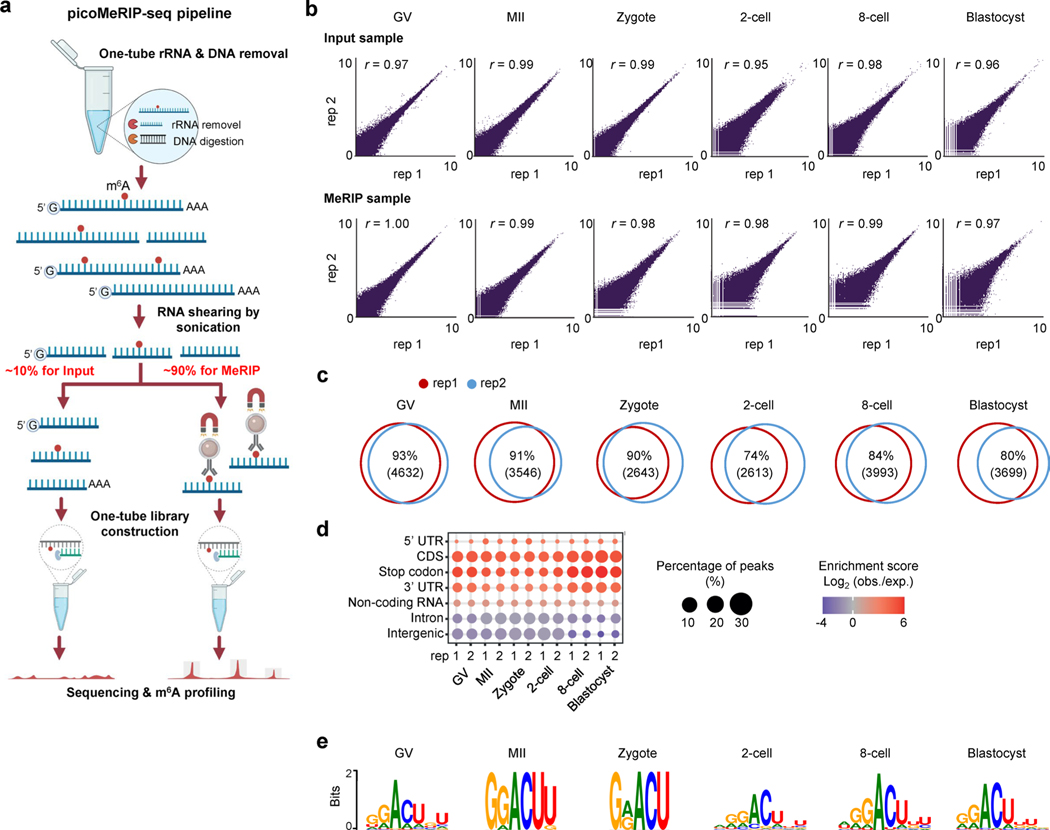
Extended Data Fig. 1 |. picoMeRIP-seq pipeline and m6A profiles in mouse oocytes and preimplantation embryos.
(a) Workflow of picoMeRIP-seq, created with BioRender.com. (b) Pearson correlation analyses between two biological replicates of 6 stages. (c) Overlap analysis of m6A marked genes between two biological replicates. (d) Bubble plot showing the relative enrichment in different genomic features. For each feature, the enrichment score was calculated as the log2 ratio of the observed over expected peak numbers. (e) Consensus motifs identified using the peaks called in the biological replicate 2.

