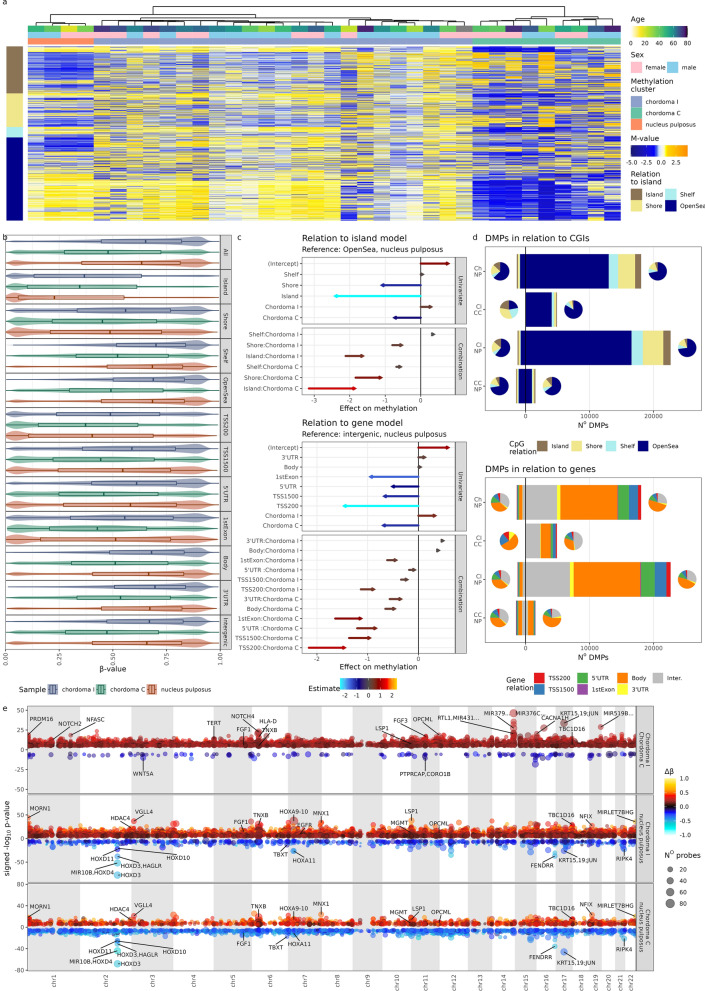
Fig. 1.
Results from EPIC DNA methylation arrays a Heatmap of scaled methylation M-values of 3648 most variable probes, split in rows, according to CpG relation to CGI and clustering of samples. b Beta values of 364,784 probes with standard deviation of β-values above 0.1, split according to CpG relation to CGI and gene. c Quantification of differences in overall methylation levels using a linear model of M-values. d Distribution of differentially methylated probes classified according to their position regarding CGI and genes. e Differentially methylated regions, depicted on Manhattan plots (genomic position on x-axis), gene names for most significant and biologically interesting DMRs are captioned

