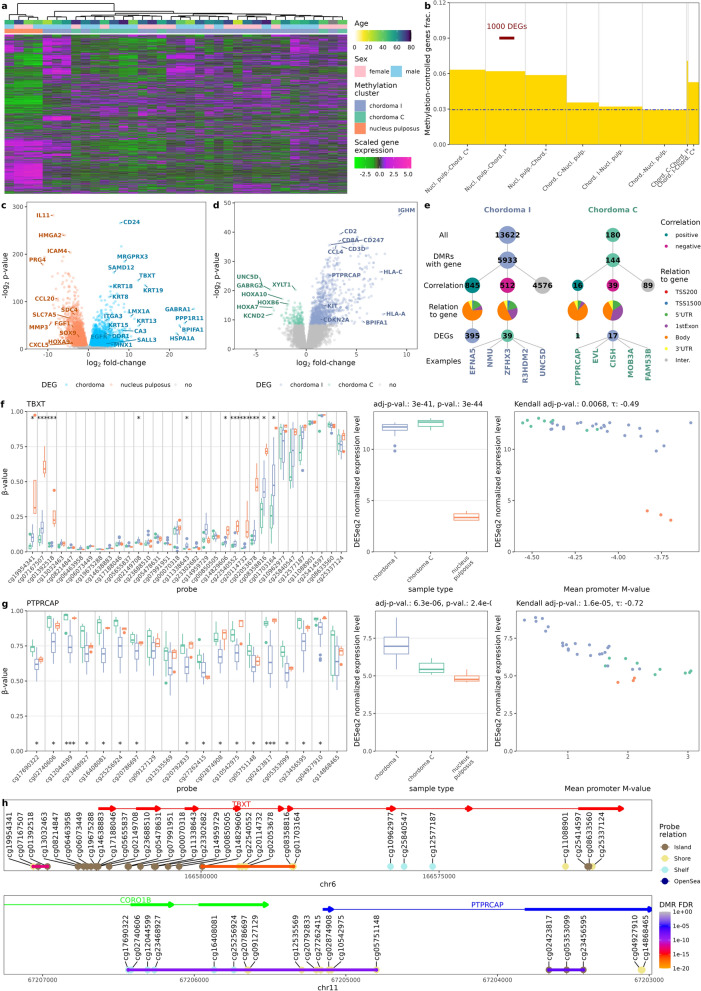
Fig. 2.
Analysis of genes expression and its relation to the DNA methylation profile. (a) Heatmap of 4275 top most variably expressed genes and their clustering showing lack of clear overlap between methylation and expression-based chordoma clusters (b) Fraction of genes differentially expressed between chordoma subtypes as well as chordomas and nucleus pulposus that are under DNA methylation control (as defined by significant correlation of mean promoter methylation with gene expression), the blue dot-and-dash line indicates the level of methylation control of the genome in general (c) Volcano plot of differentially expressed genes identified in chordoma—nucleus pulposus comparison (d) Volcano plot of differentially expressed genes found in chordoma I—chordoma C comparison (e) DMR relation to DEGs in chordoma I—chordoma C comparison, height of the bars represents number of genes/DMRs (f) Role of DNA methylation in TBXT (brachyury) gene. Difference in the methylation levels of CpGs at TBXT locus with DMPs labeled with *(for adj.p < 0.05), **(for adj.p < 0.001) or ***(for p-value <9*10−8) (left panel), difference in TBXT expression of (middle panel) and correlation between TBXT promoter methylation and expression levels (right panel); p-values are shown for chordoma-nucleus pulposus comparison (g) Difference in the methylation levels of CpGs at PTPRCAP locus with DMPs labeled with *(for adj.p < 0.05), **(for adj.p < 0.001) or ***(for p-value < 9*10−8) (left panel), difference in PTPRCAP expression of (middle panel) and correlation between PTPRCAP promoter methylation and expression levels (right panel) (h) Position of TBXT (brachyury) and PTPRCAP genes on their chromosomes, along with EPIC methylation probes position and DMR

