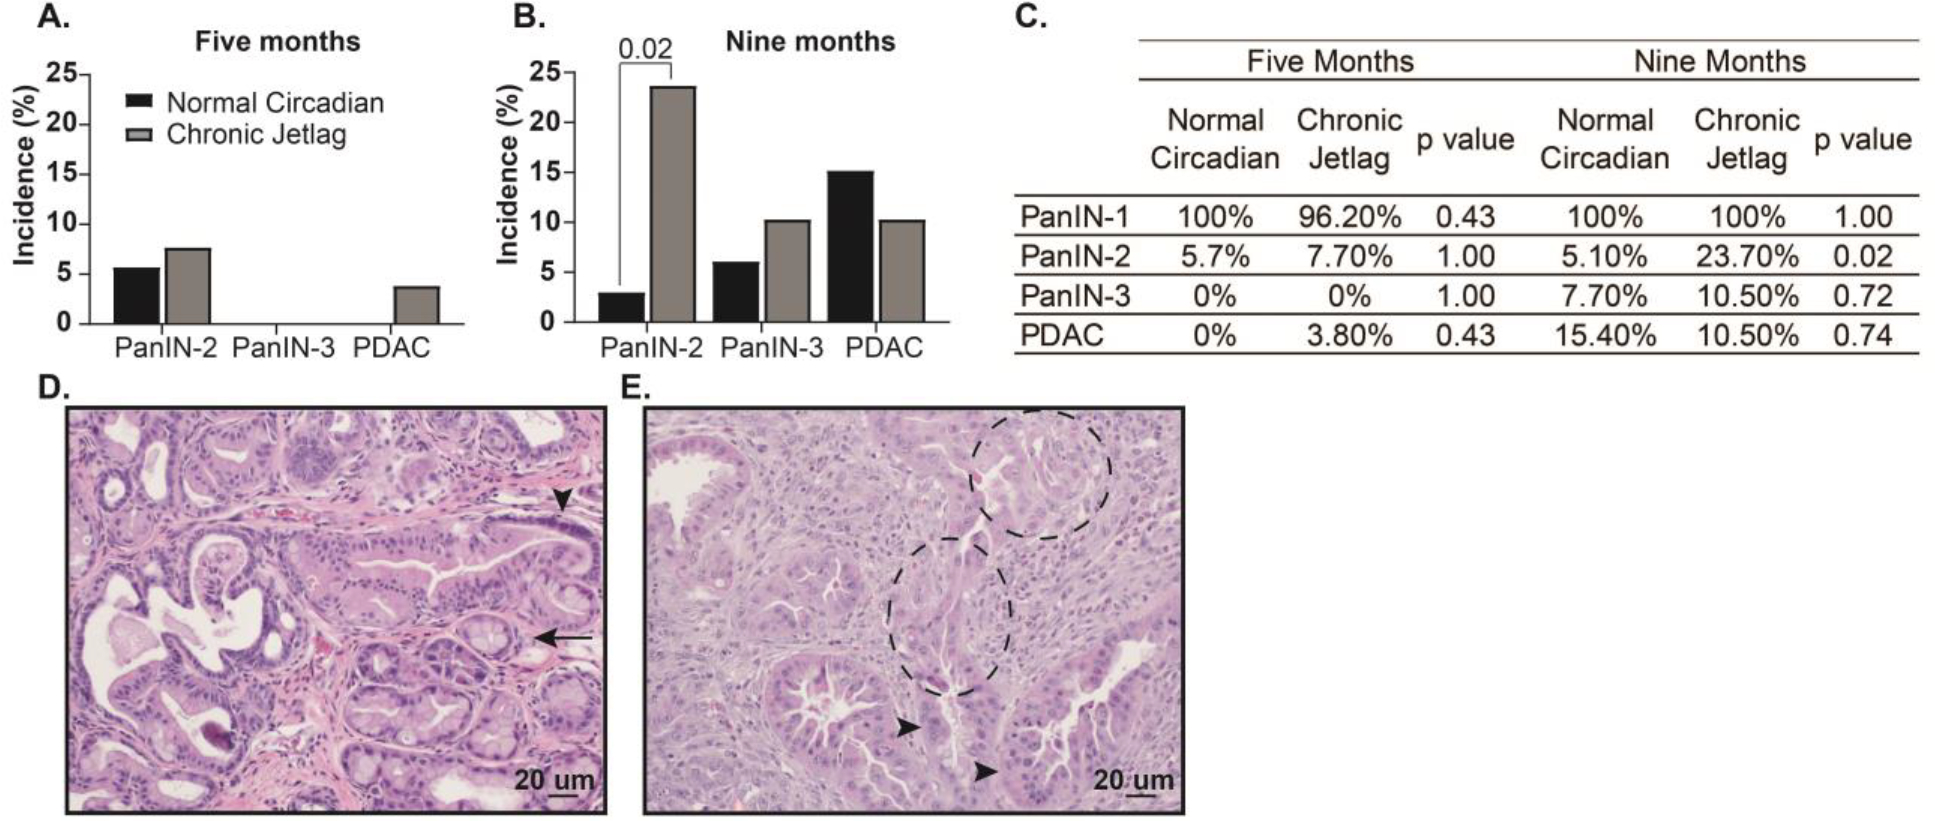
Figure 2: Chronic jetlag accelerates the grade of PanIN lesions.

Bar charts indicating the incidence of PanIN-1-3 and PDAC in normal circadian (black) and chronic jetlag (grey) conditions at A. 5 months (normal circadian n = 36 vs. chronic jetlag n = 26) and B. 9 months (normal circadian n = 33 vs. chronic jetlag n = 39). C. Table showing the Fischer’s Exact Test comparisons between 5- and 9-month normal circadian and chronic jetlag mice. Representative H&E images are shown to demonstrate the various pancreatic pathologies being quantified. D. Representative 200x H&E image from a chronic jetlag mouse demonstrating PanIN-1 (arrow) and PanIN-2 lesion (arrowhead). E. Representative 200x H&E image from a chronic jetlag KC mouse demonstrating a PanIN-3 lesion (arrowhead) and PDAC off the same gland (dashed circle). Scale bars are shown for reference.
