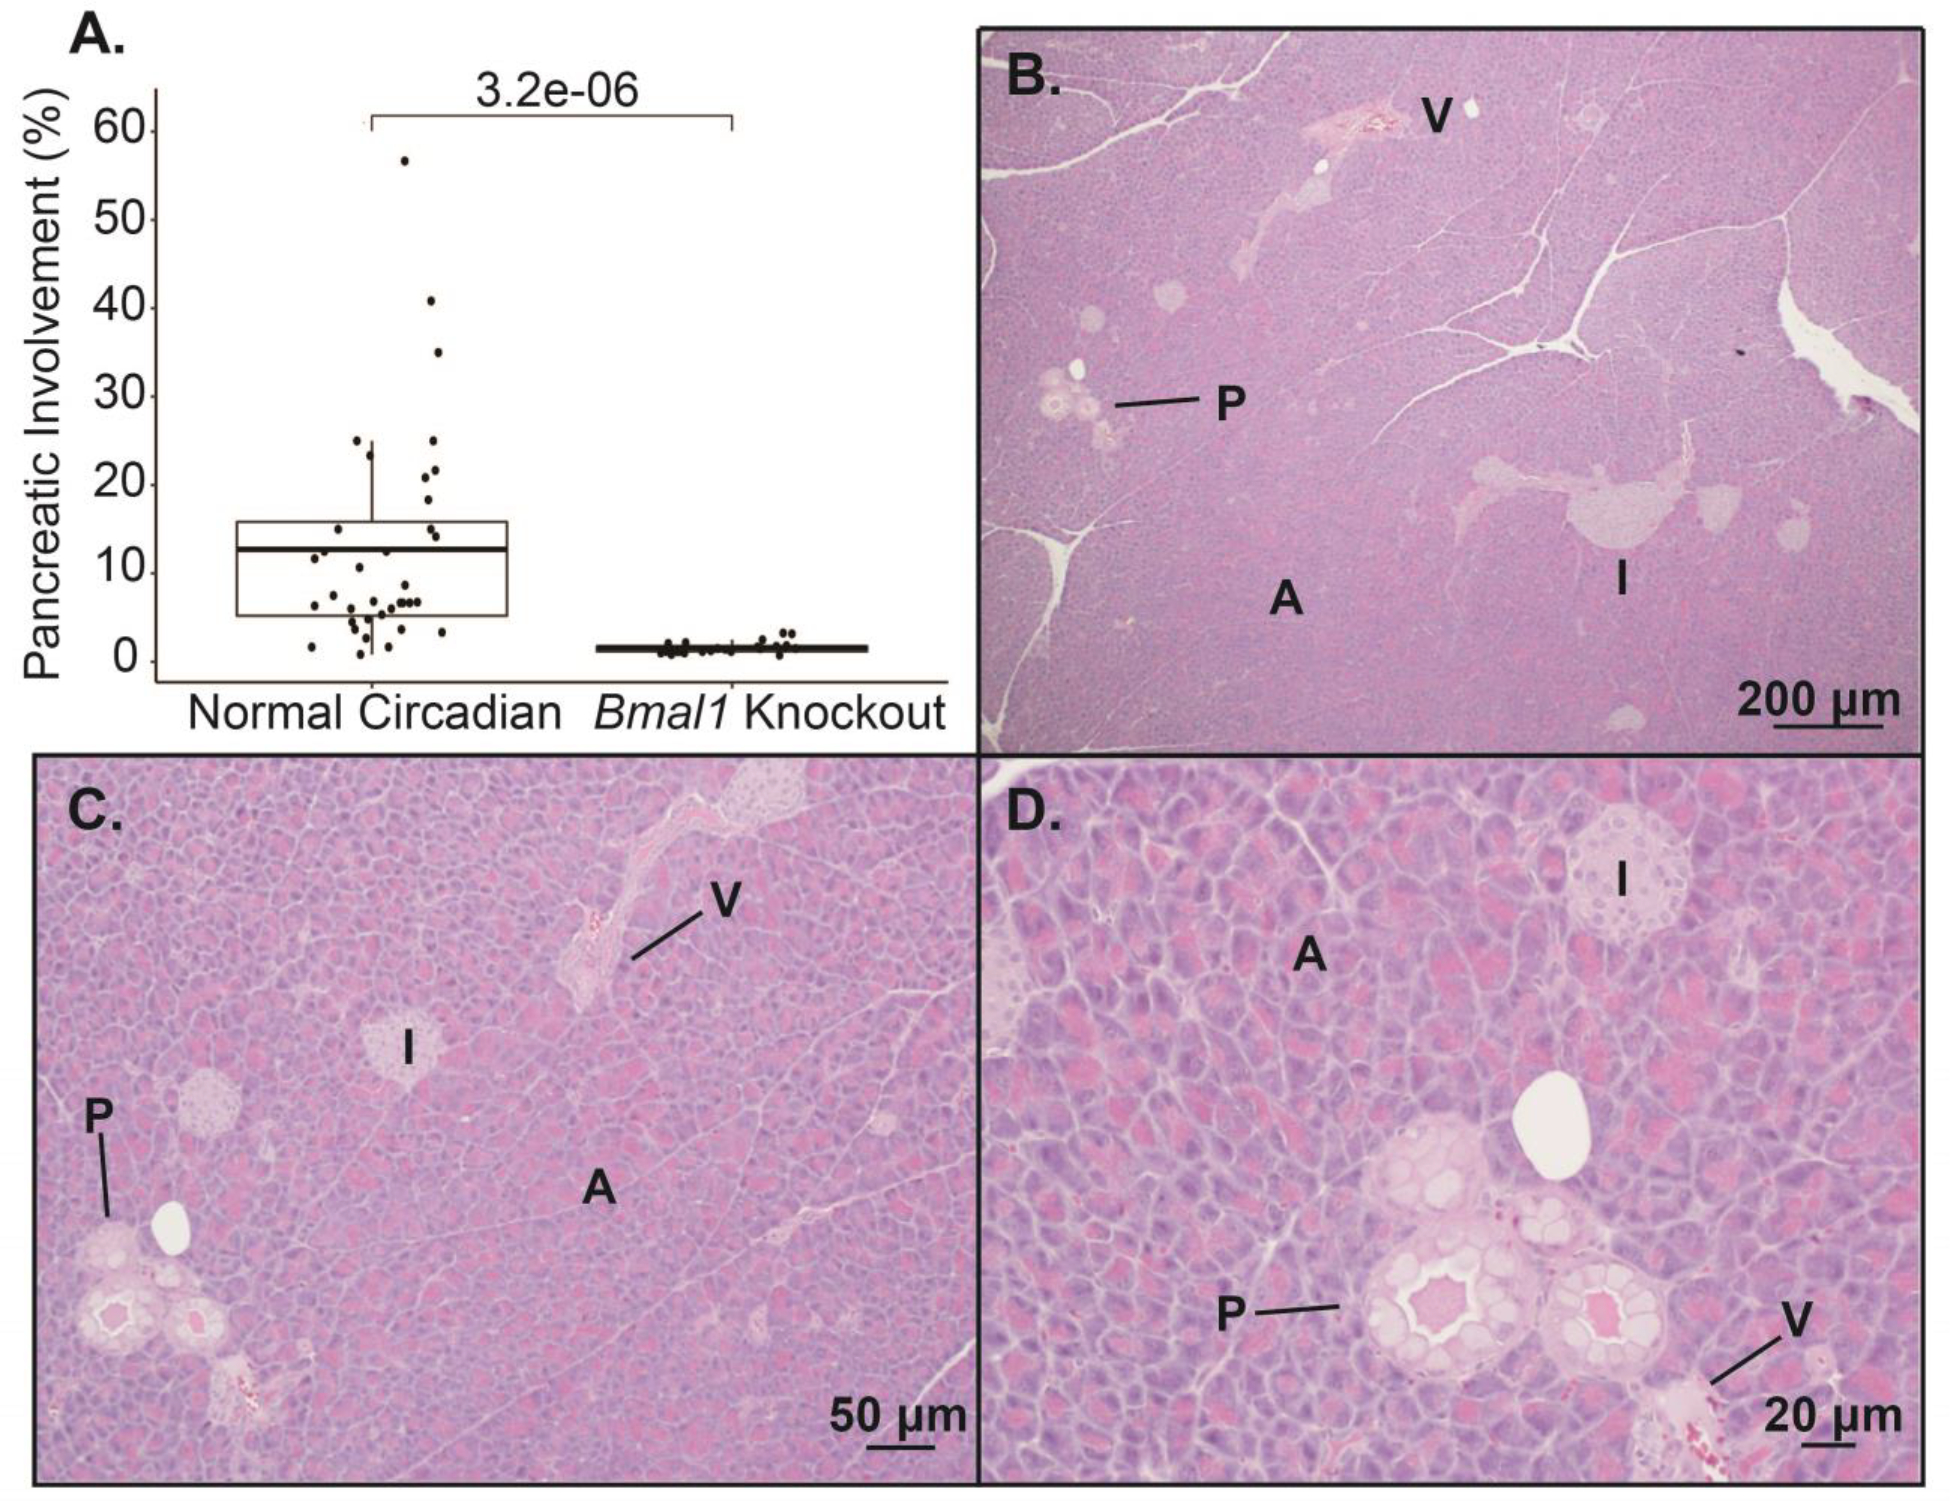
Figure 3: Pancreatic cell-autonomous deletion of Bmal1 does not accelerate pancreatic fibroinflammatory infiltrate/PanIN development at five months.

A. Boxplot comparing the mean (with associated 25th and 75th quantiles) percent pancreatic involvement of fibroinflammatory infiltrate/PanIN at 5 months for normal circadian KC (n= 36) and BKC mice (n = 24). Representative H&E images demonstrating the fibroinflammatory infiltrate/PanIN from a BKC mouse at 40x (B), 100x (C), and 200x (D) Scale bars are shown for reference. [annotation: PanIN (P), acinar (A) cells, islet (I) cells, ductal (D) cells, vascular (V) cells (i.e. endothelial cells), and fibroinflammatory (F) infiltrate]
