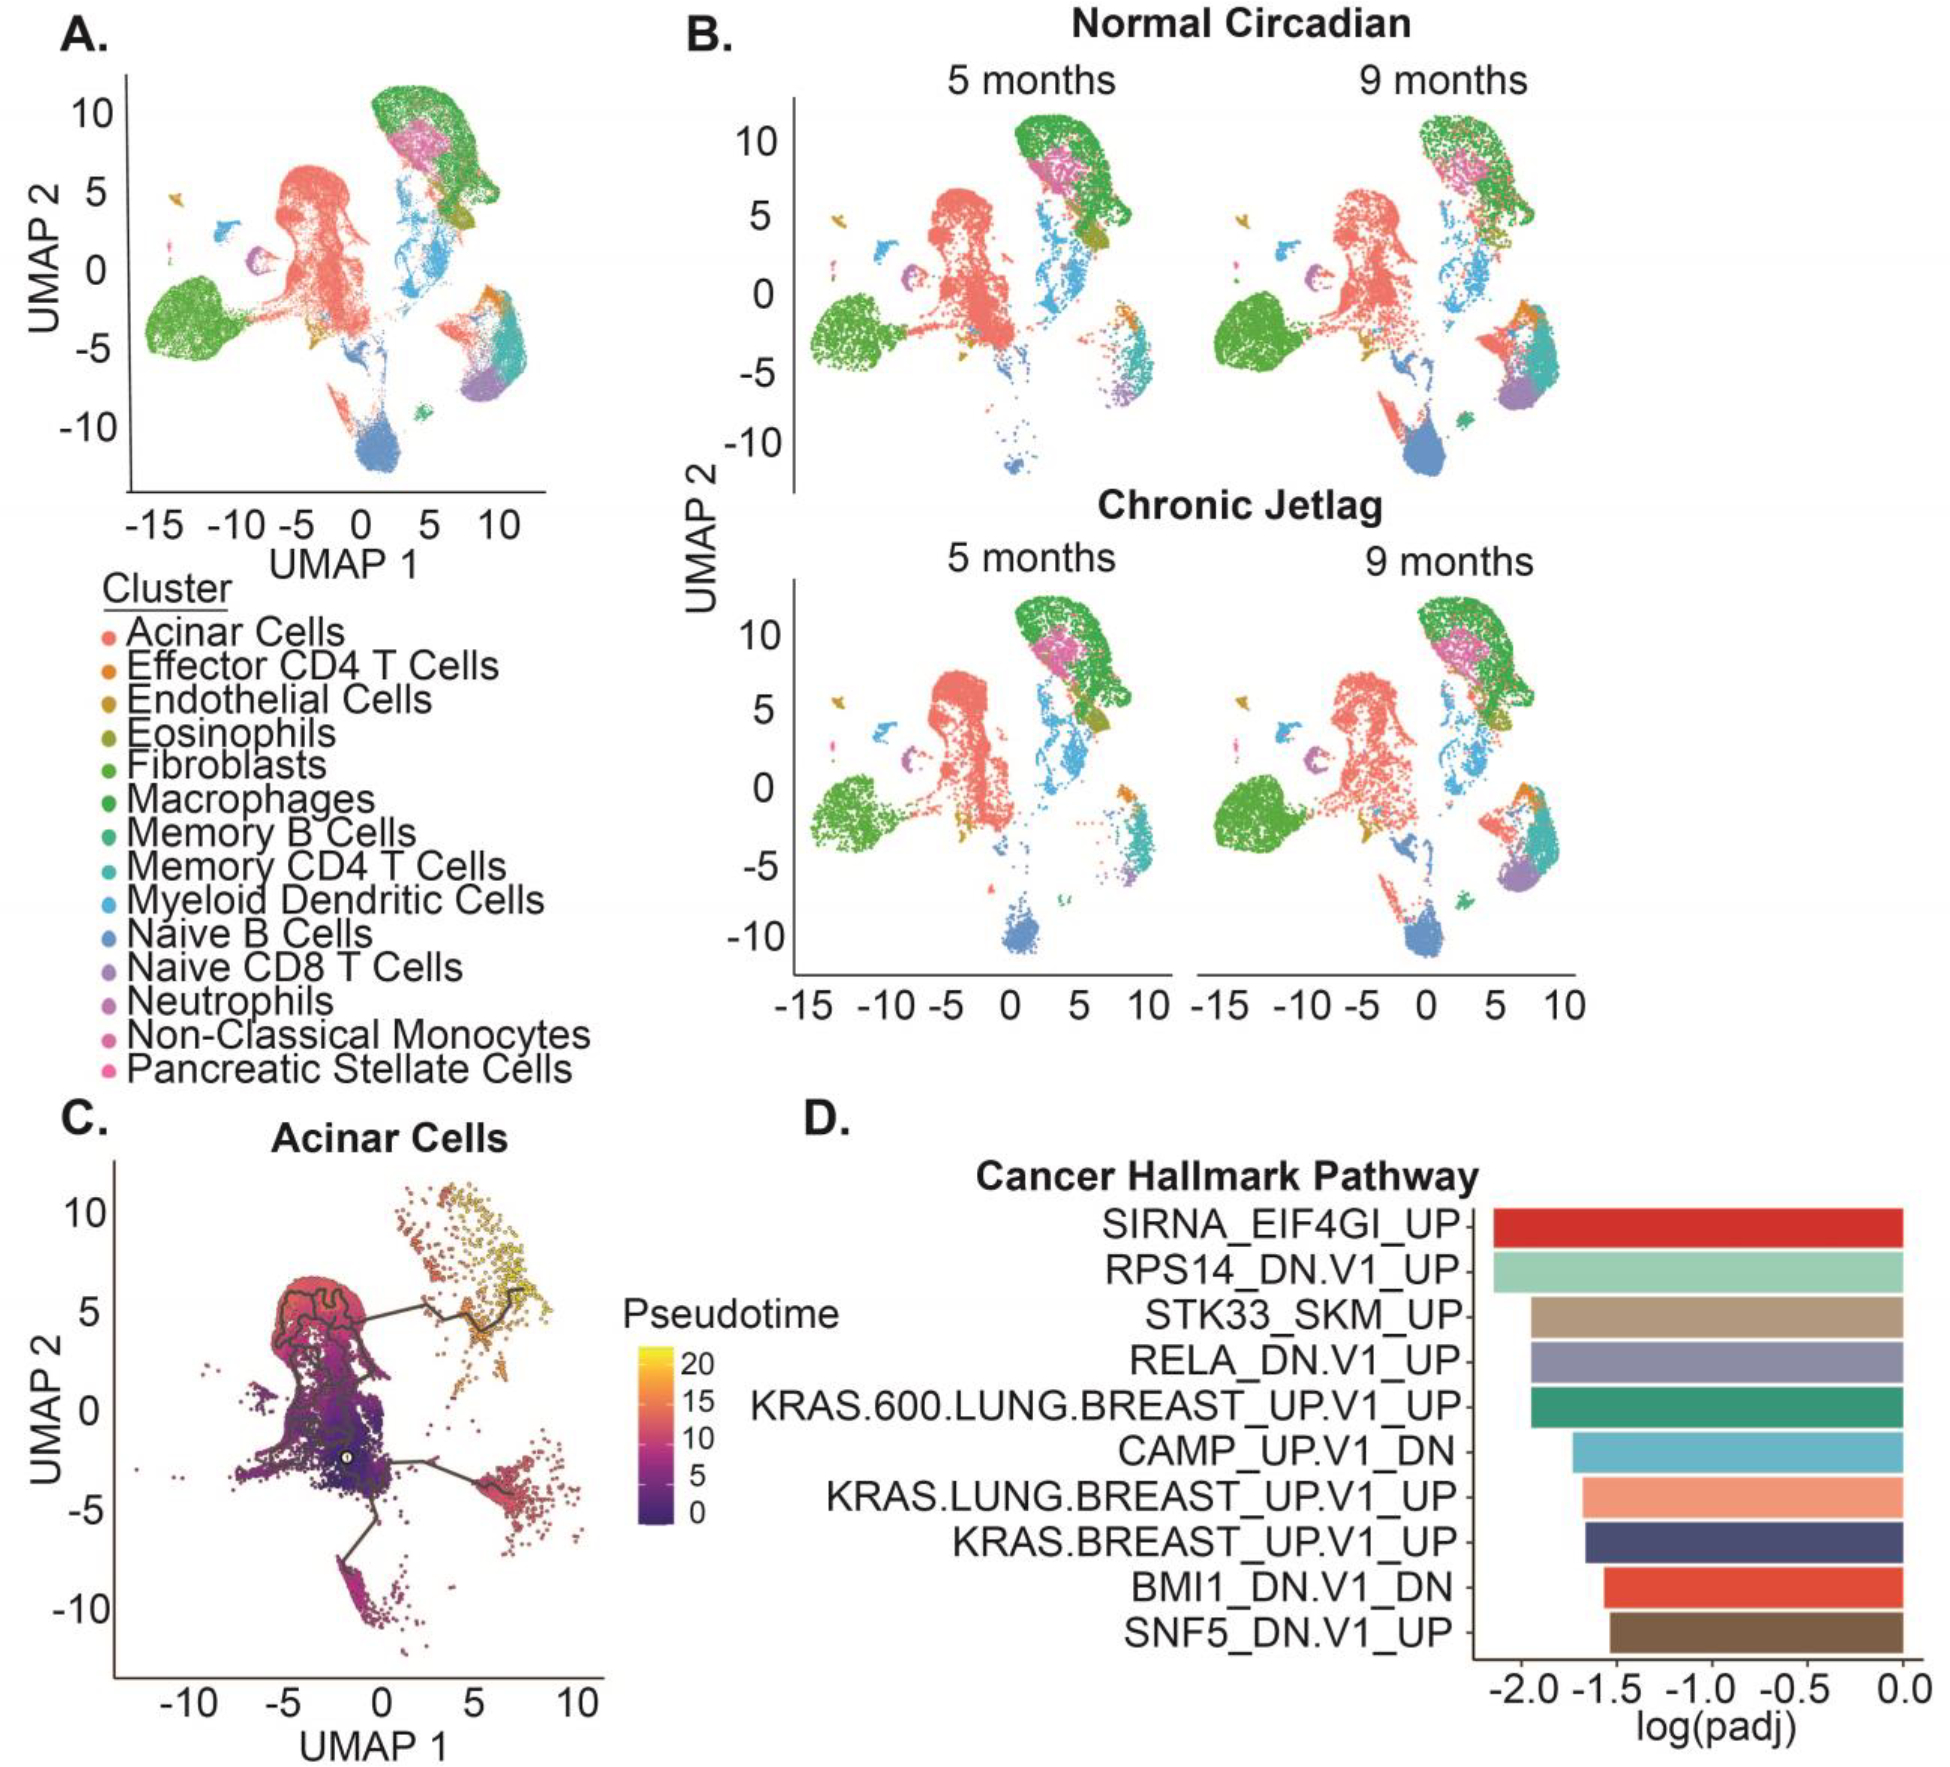
Figure 6: The single-cell landscape of KC mice recapitulates the developing pancreatic cancer tumor microenvironment.

A. UMAP demonstrating the 14 diverse cell types and 42,211 cells in the scRNAseq dataset. B. UMAPs split by time (five and nine months) and condition (normal circadian and chronic jetlag) C. Pseudotime trajectory analysis was performed for the subset of pancreatic acinar cells with zero pseudotime set to the point with the highest fraction of cells at five months. D. Gene Set Enrichment Analysis (GSEA) was performed for the oncogenic signature gene set associated with pseudotime progression and ordered by the log adjusted p value.
