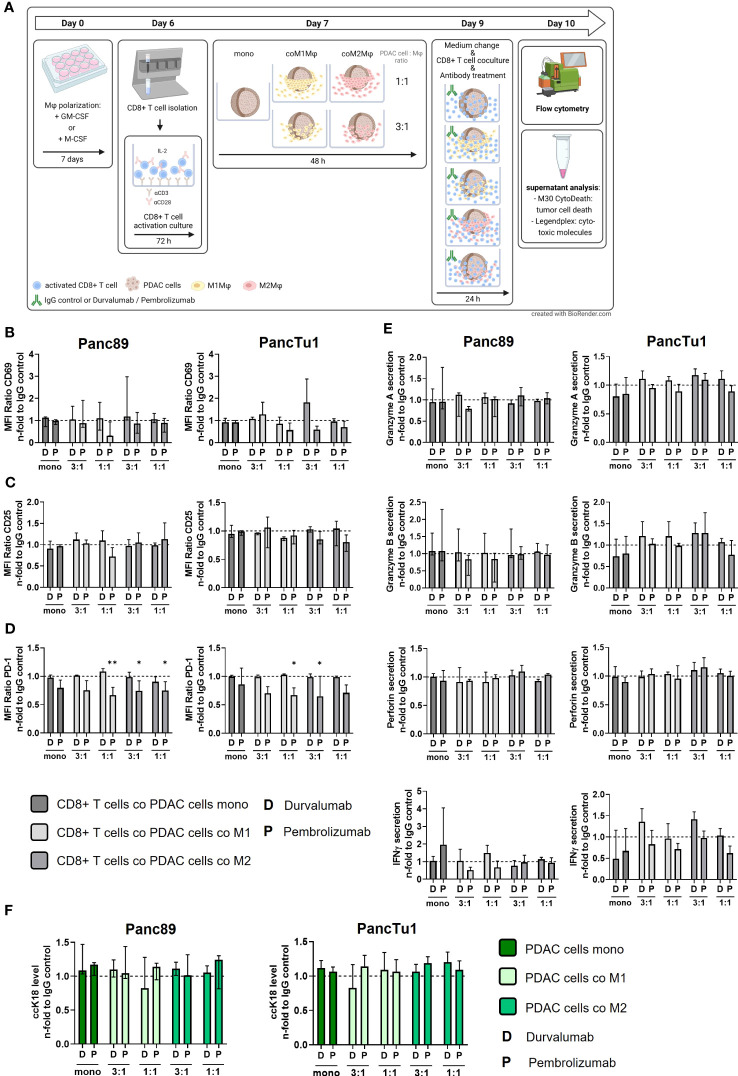
Figure 5.
Blocking of PD-1 and PD-L1 only slightly affects the effector phenotype of CD8+ T cells and does not increase PDAC cell death. PancTu1 or Panc89 cells were mono- or co-cultured with either M1- or M2-like polarized Mϕ in ultra-low attachment plates to form spheroids. After 48 h, medium was changed, mono- or co-cultures were treated with either Durvalumab (D) or Pembrolizumab (P) or their respective isotype controls (10 µg/ml) and CD8+ T cells were added for 24 h. (A) Schematic illustration of experimental set-up. Immunofluorescence staining of activation marker (B) CD69, (C) CD25 and (D) PD-1 on CD8+ T cells cultured with mono-cultured PDAC cell spheroids (dark grey) or co-cultured Panc89 (left panel) or PancTu1 (right panel) cell spheroids with M1Mϕ (light grey) or M2Mϕ (middle grey). Immunofluorescence staining was measured by flow cytometer and data is normalized to the respective IgG control samples of the indicated culture conditions. (E) Granzyme A, Granzyme B, Perforin and IFNγ concentration of supernatants of CD8+ T cells cultured with either mono-cultured (dark grey) Panc89 (left panel) or PancTu1 spheroids (right panel) or with the indicated co-cultures with M1- (light grey) or M2Mϕ (middle grey) spheroids. Concentrations were measured by multiplex assay and data was normalized to the respective IgG control samples of the indicated culture conditions. (F) Levels of caspase-cleaved Keratin 18 (ccK18) in supernatants of CD8+ T cells cultured with mono-culture spheroids of Panc89 (left) or PancTu1 cells (right) or with the indicated Mϕ co-culture conditions. ccK18 levels were normalized to the respective PDAC cell count and then to the respective IgG control samples of the indicated co-culture conditions. Mono: 2x10⁴,ratio 3:1: 1.5x10⁴ PDAC cells and 0.5x10⁴ Mϕ; ratio 1:1: 1x10⁴ PDAC cells and 1x10⁴ Mϕ. Not normally distributed data are depicted as median with interquartile range in both directions. Two-way ANOVA with Dunnett’s multiple comparison test comparing all samples with a control of 1. The dashed lines mark an MFI ratio of “1”. n=3. * = p<0.05.

