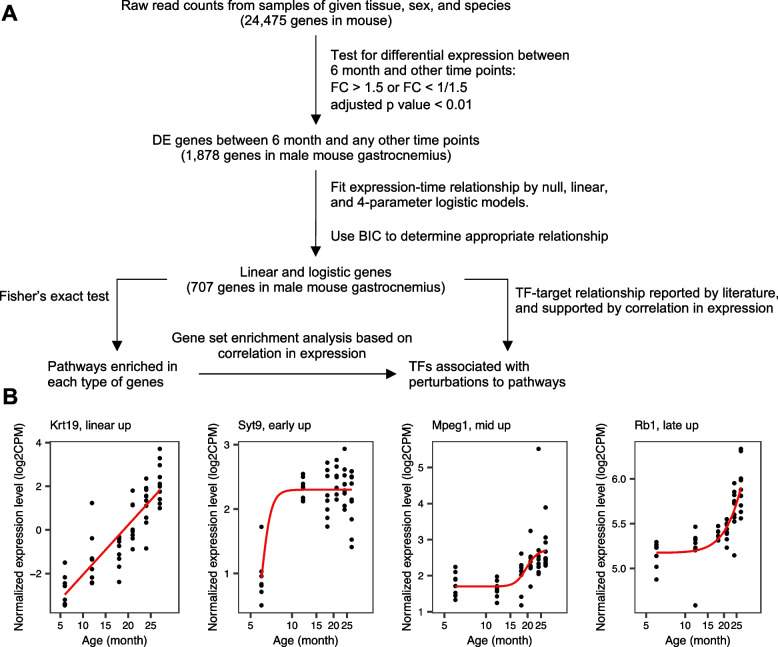
Fig. 1.
Summary of the analysis. A Flowchart for identifying age-related genes, pathway enrichment analysis, and transcription factor (TF) association analysis. RNA-seq data were processed from each species, sex, and tissue separately. The raw gene expression counts were normalized using the limma package, and the normalized data were used to first identify differentially expressed (DE) genes. Genes were considered differentially expressed if their expression was upregulated or downregulated by ≥ 1.5 fold at any age compared to 6 months, with the adjusted p value of > 0.05. To define age-related genes, we fitted the trend of a DE gene by null, linear, and a 4-parameter logistic model. Bayesian information content (BIC) was used to identify the best model among the three, and DE genes with a linear or a logistic trend were considered age-related. Next, age-related genes, with linear and logistic behaviors were used to perform pathway enrichment analyses and transcription factor (TF) motif enrichment. B Examples of age-related genes that follow a linear pattern, or early, mid-, or late-logistic patterns (shown for the mouse gastrocnemius)

