Fig. 2.
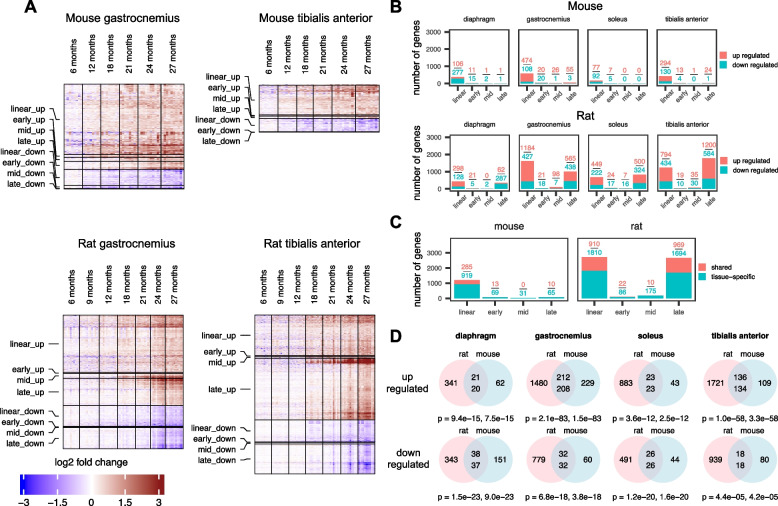
More age-related genes were demonstrated in the skeletal muscle of rats compared with mice. A Heatmaps showing expression of age-related genes in the gastrocnemius and the tibialis anterior muscle in male mice and male rats across multiple ages (6–27 months). Gene expression fold change was calculated using the average normalized log2 CPM (counts per million) of samples at 6 months as reference. Red color represents increase in gene expression relative to 6 months, with the deepest red being an increase of ≥ eight fold. Blue color represents decrease in gene expression relative to 6 months, with the deepest blue being a decrease of ≥ eight fold. In heatmaps, each row represents a single gene, and each column represents a single animal. N = 6–8 mice and N = 9–13 rats per group respectively. B Numbers of linear and logistic age-related genes in diaphragm, gastrocnemius, soleus, and tibialis anterior muscles from male mice and rats. Red boxes represent number of upregulated genes, and green boxes represent number of downregulated genes. C Numbers of age-related genes whose expression changed in the same direction (up or down) and had the same classification (linear or logistic) in at least two muscles from the same species (mouse or rat). Red boxes represent upregulated genes and green boxes represent downregulated genes. D Venn diagrams showing age-related genes that were orthologous in the muscles of rats and mice. Pink circles are rat age-related genes that have a mouse ortholog, and blue circles are mouse age-related genes that have a rat ortholog. Top numbers in the intersections show the number of rat genes whose expression changes in the same direction as their respective mouse ortholog (significance shown by the first P value). Bottom numbers in the intersections show the number of mouse genes whose expression changes in the same direction as their respective rat ortholog (significance shown by the second P value). P values are derived by Fisher’s exact test (see the “Methods” section for details)

