
Figure 4. Visualization of α-syn monomers and α-syn fibrils via transmission electron microscopy.
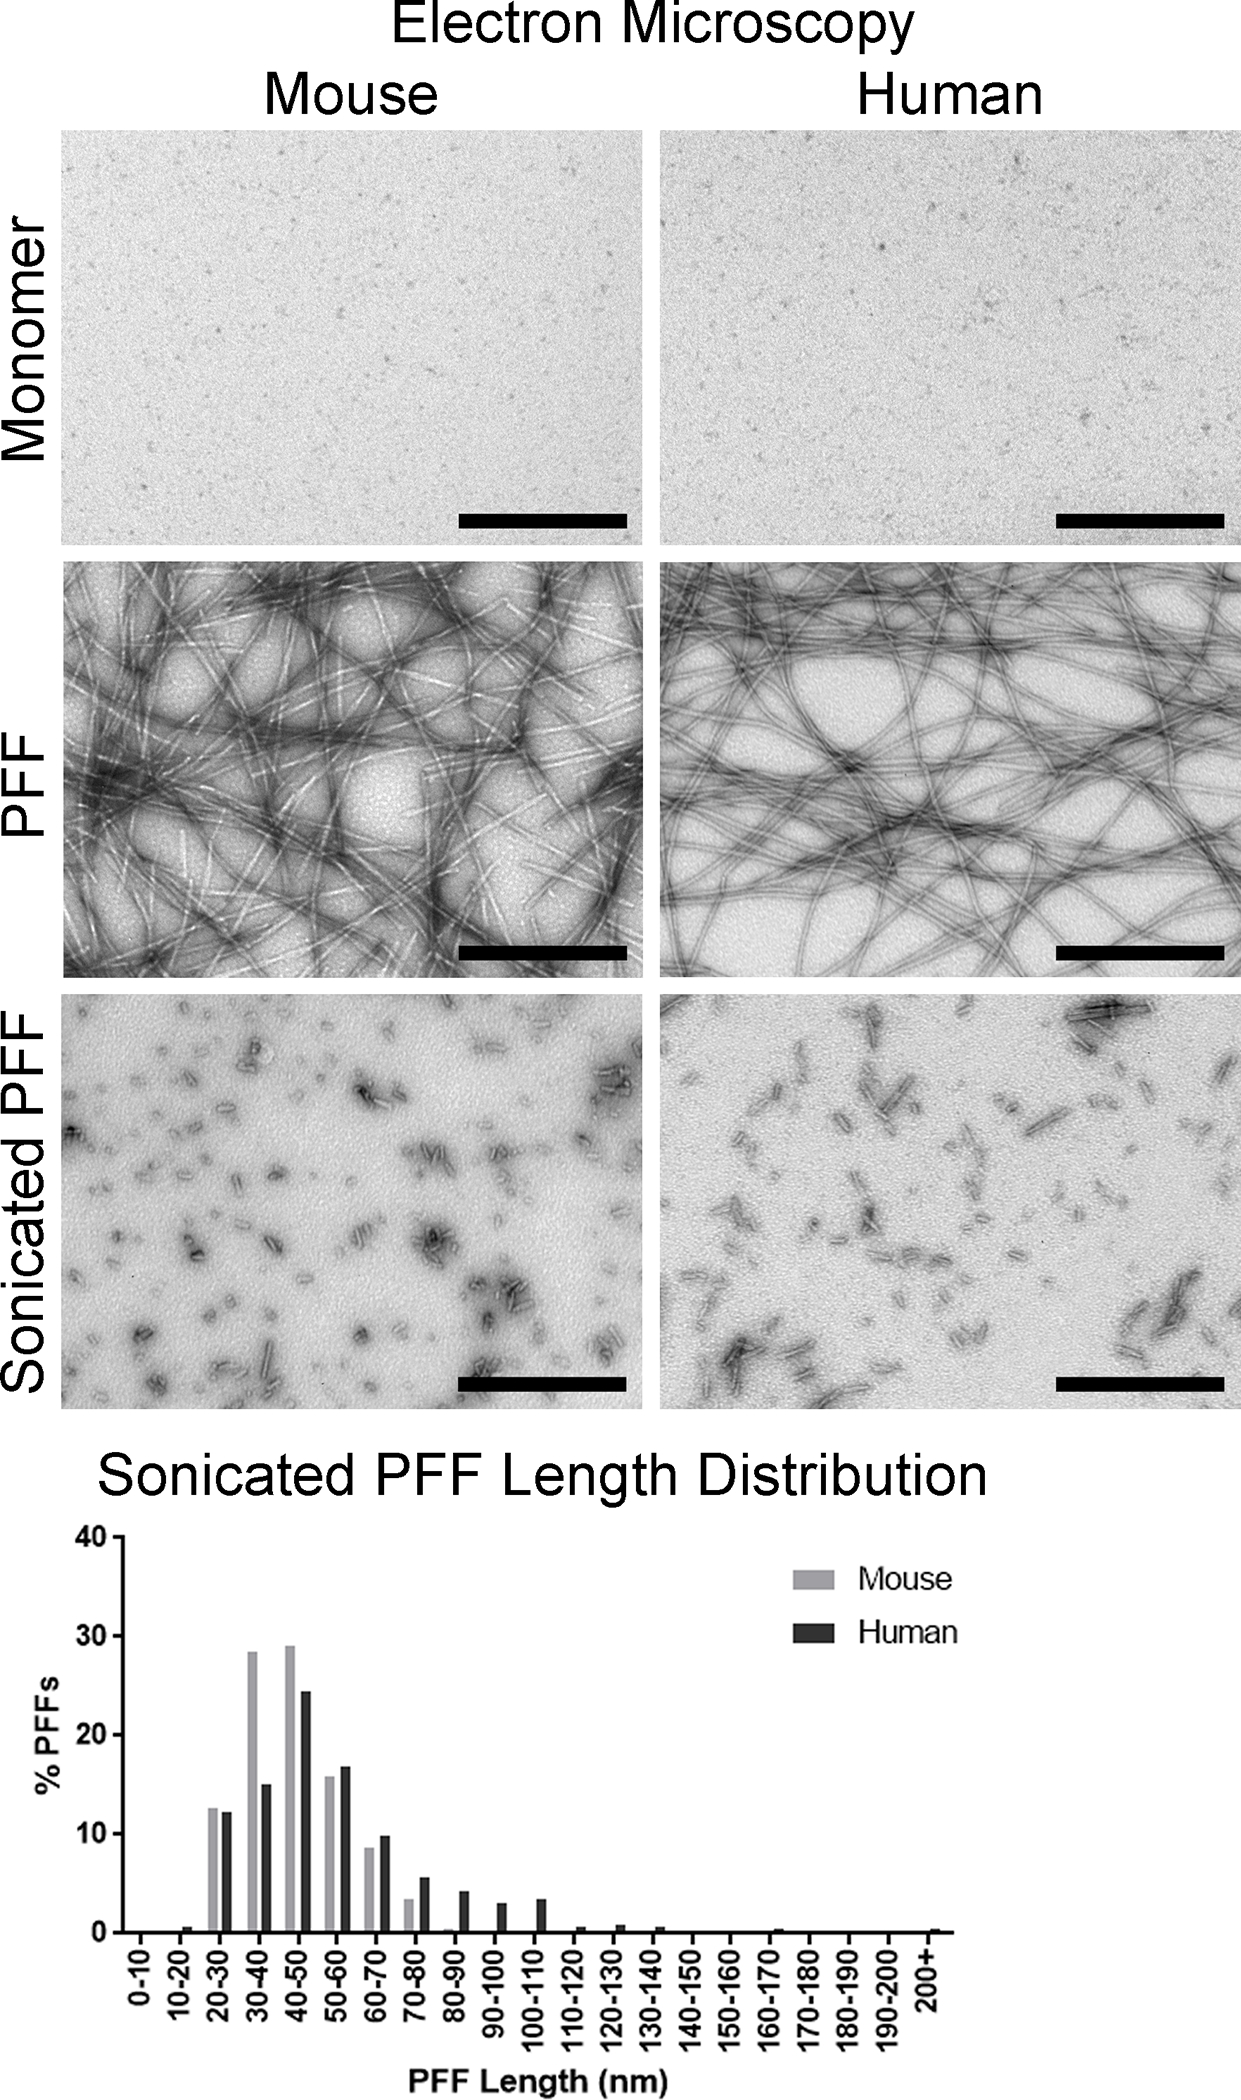
Representative micrographs of α-syn monomers and fibrils. Top panels: Mouse and human α-syn monomer. Middle panels: Full length mouse and human α-syn PFFs. Bottom panels: Mouse and human α-syn PFFs after sonication. Bottom graph: Distribution of sonicated mouse and human α-syn PFF lengths. Scale bar = 500 nm.