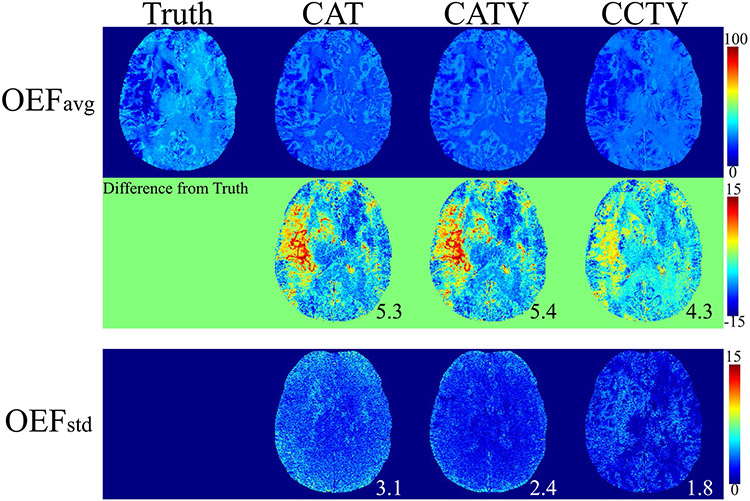
FIGURE 1.
Comparison between the oxygen extraction fraction (OEF) obtained by QQ (QSM + qBOLD) CAT (cluster analysis of time evolution), QQ-CATV (CAT + total variation), and the proposed QQ-CCTV (temporal clustering, tissue composition, and total variation) in a simulated stroke data set. The numbers indicate mean absolute error (MAE; black) and mean SD (MSD; white). On average, QQ-CCTV provides the greatest accuracy (smallest MAE 4.3%) and precision (smallest MSD 1.8%). OEFavg and OEFstd indicate the average and SD OEF maps among five trials, respectively

